Fig. 13.
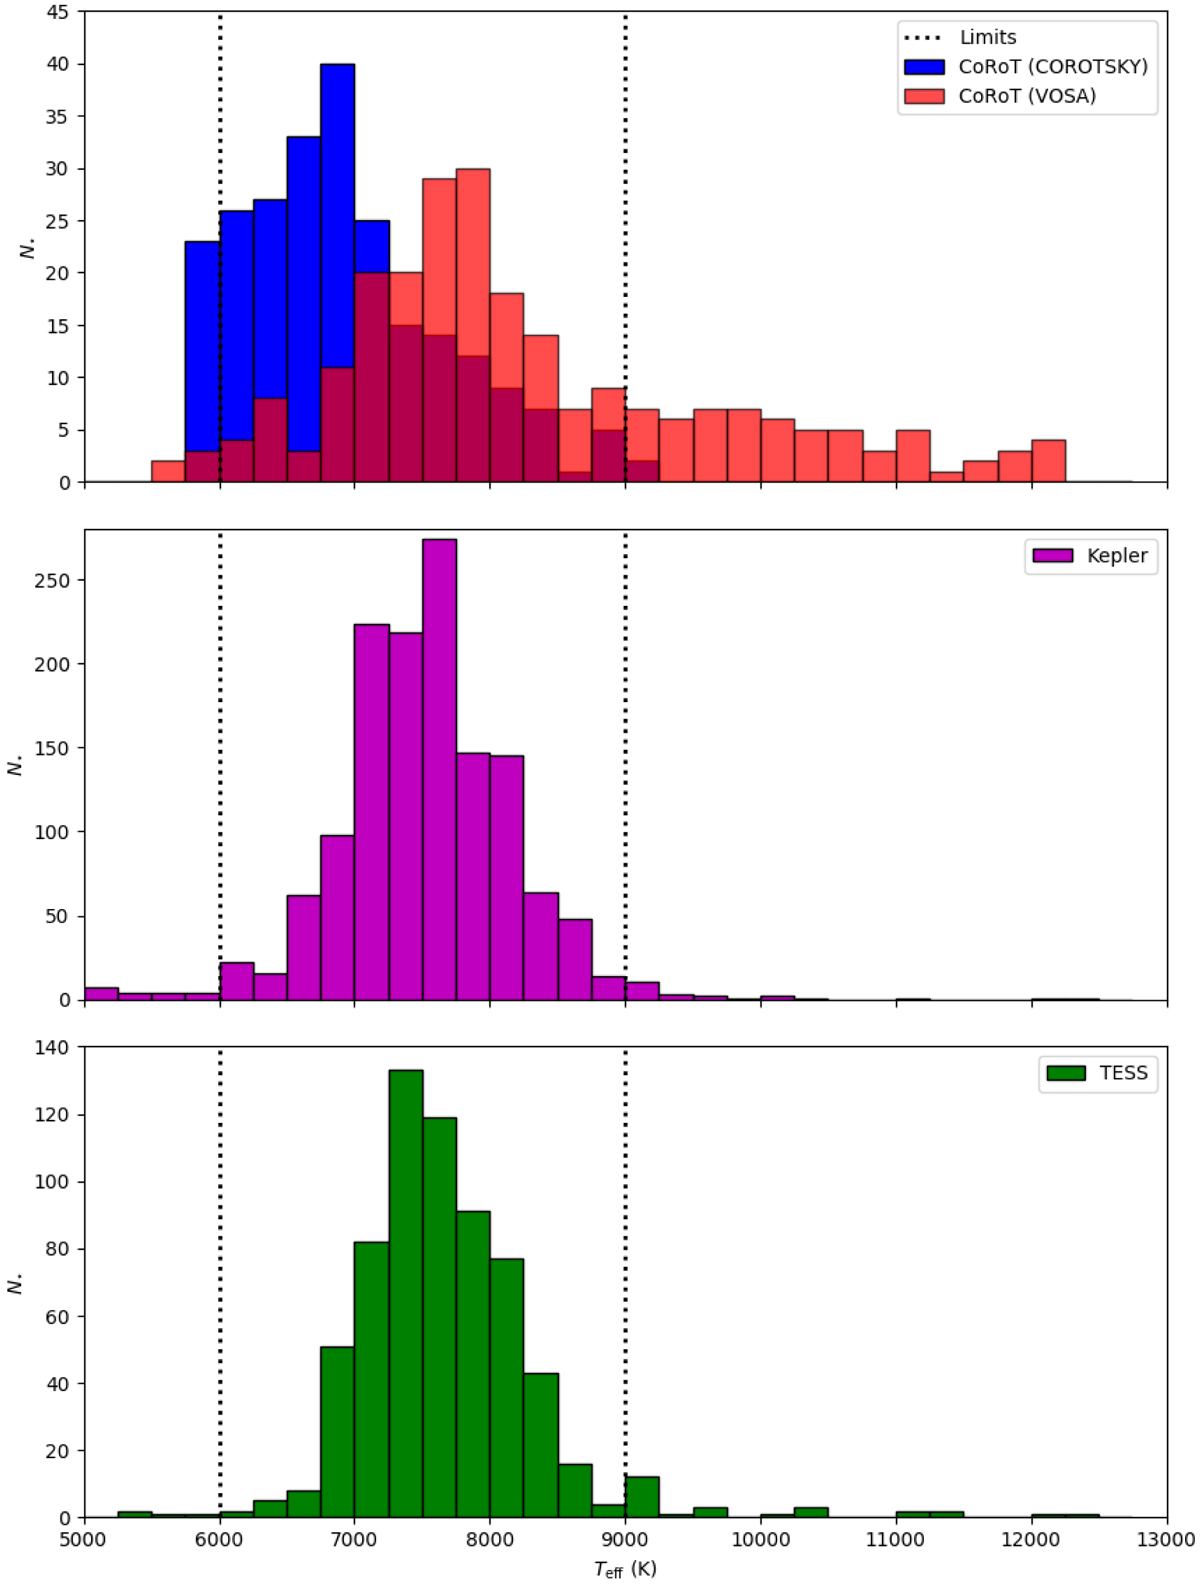
Top panel: histogram of temperatures for 239 δ Scuti star candidates observed by CoRoT. Blue bars point to values from COROTSKY database (Charpinet et al. 2006) and red bars point to the values obtained with VOSA (see text). Dotted lines represent the temperature limits for δ Scuti stars (Uytterhoeven et al. 2011). Middle and bottom panels: same as top panel for stars of our main sample observed by Kepler and TESS, respectively.
Current usage metrics show cumulative count of Article Views (full-text article views including HTML views, PDF and ePub downloads, according to the available data) and Abstracts Views on Vision4Press platform.
Data correspond to usage on the plateform after 2015. The current usage metrics is available 48-96 hours after online publication and is updated daily on week days.
Initial download of the metrics may take a while.