Fig. 11.
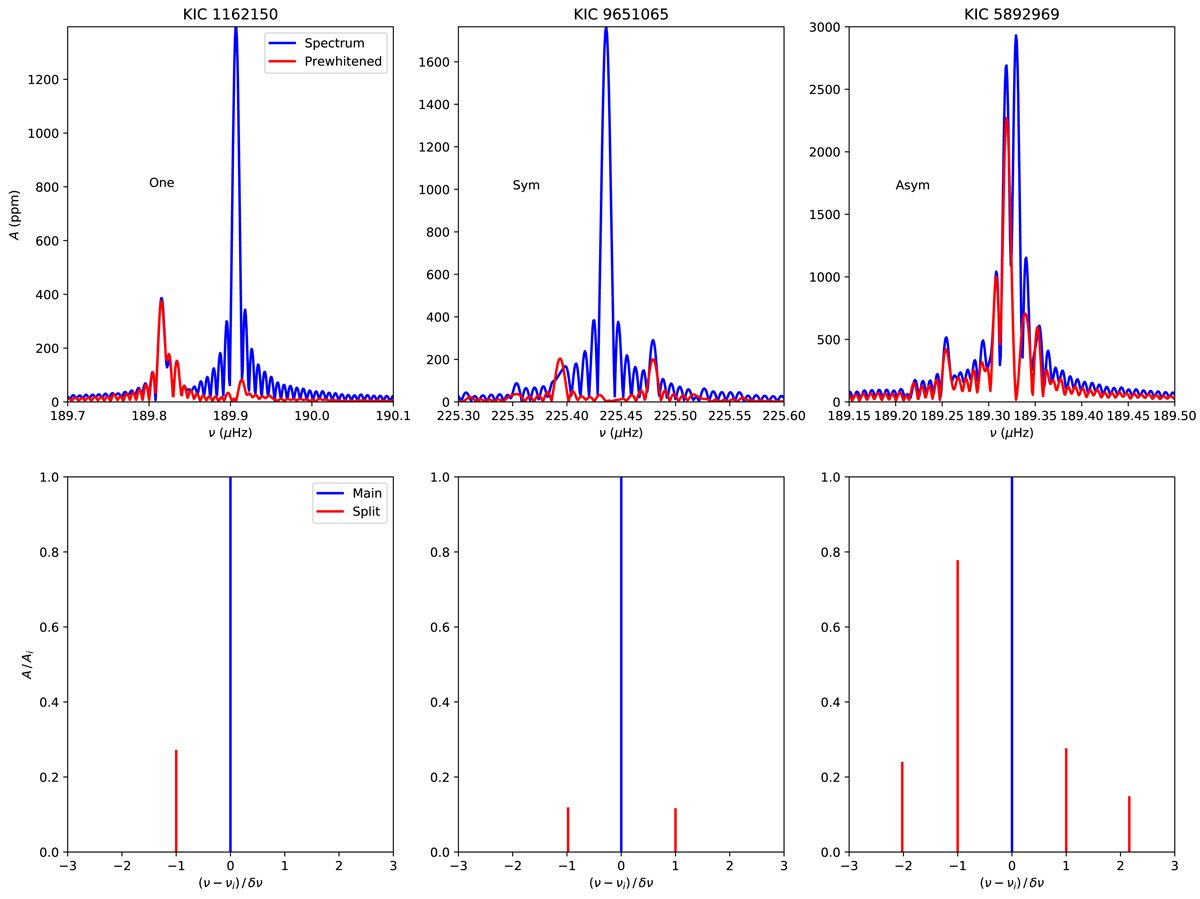
Multiplets with one (left), symmetric (middle), and asymmetric (right panels) sidelobes. Top panels: detail of the original ten-point oversampled power spectrum (blue) and also after extracting the central peak (red). Bottom panels: detected peaks using δSBF taking into account the frequency shift between split peaks and their amplitude ratios. Blue points to the central peak and red points to split peaks.
Current usage metrics show cumulative count of Article Views (full-text article views including HTML views, PDF and ePub downloads, according to the available data) and Abstracts Views on Vision4Press platform.
Data correspond to usage on the plateform after 2015. The current usage metrics is available 48-96 hours after online publication and is updated daily on week days.
Initial download of the metrics may take a while.