Fig. 10.
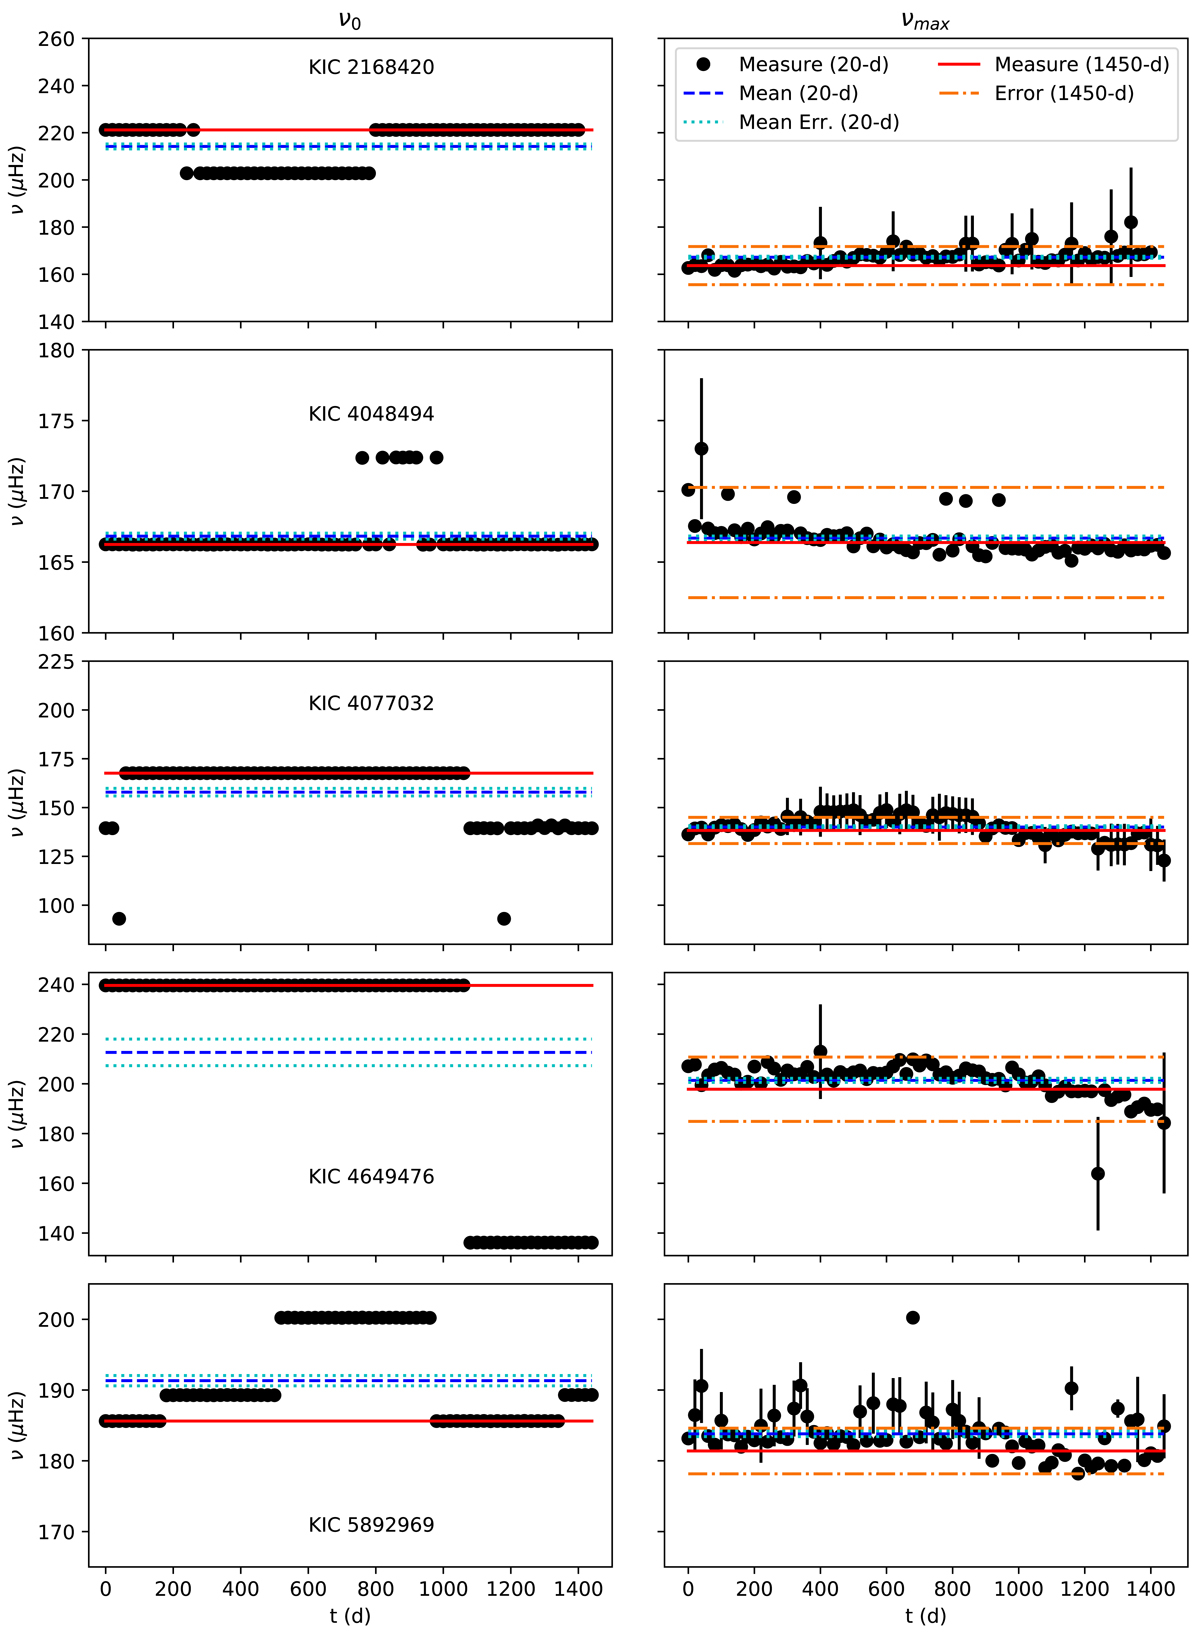
Frequency of the highest amplitude peak (ν0, left panels) and frequency at maximum power (νmax, right panels) with time for five pure δ Scuti stars with detected resonant mode coupling (one per row; see text). Black circles represent the measurements of each parameter for 20-day segments of the entire light curve. The blue dashed line is the mean value of all 20-d measurements and cyan dotted lines are their error. The red line is the measurement of each parameter for a 1450-day light curve and the orange dashed-dotted lines are their error. The error bars for 20-d measurements of ν0 are smaller than the symbol. For clarity reasons, we only plotted the error bars for 20-d measurements of νmax for those outside of the 1450-d measure error.
Current usage metrics show cumulative count of Article Views (full-text article views including HTML views, PDF and ePub downloads, according to the available data) and Abstracts Views on Vision4Press platform.
Data correspond to usage on the plateform after 2015. The current usage metrics is available 48-96 hours after online publication and is updated daily on week days.
Initial download of the metrics may take a while.