Fig. 8
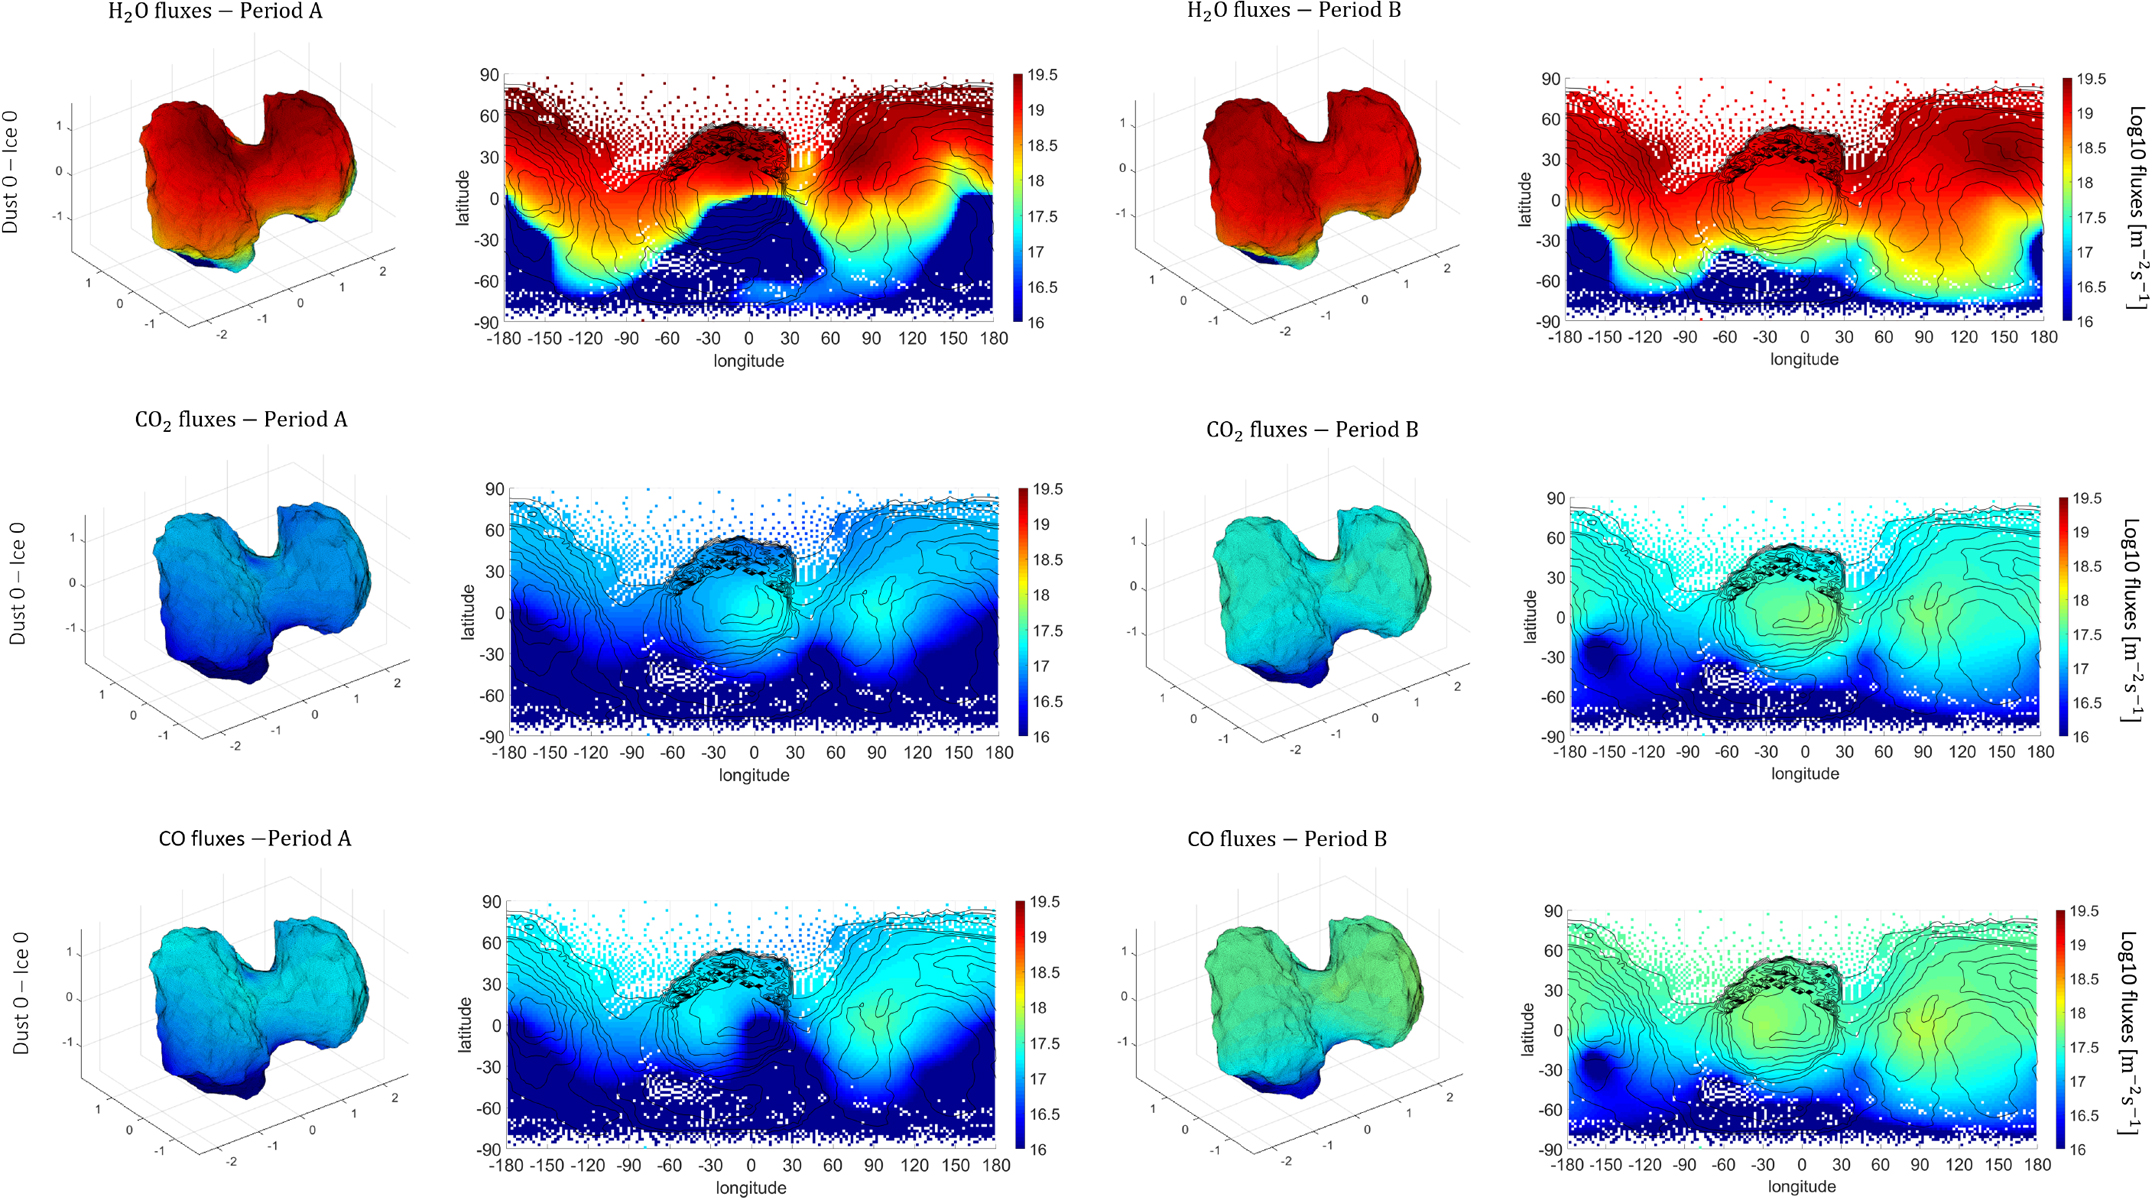
Representations in 3D and 2D of the H2O (first line), CO2 (second line), and CO (third line) averaged surface fluxes (in molec m−2 s−1) for Period A (six left panels) and Period B (six right panels) periods. The dust 0 set of parameters is used to compute the northern points and the ice 0 set of parameters is used for the equator and southern points.
Current usage metrics show cumulative count of Article Views (full-text article views including HTML views, PDF and ePub downloads, according to the available data) and Abstracts Views on Vision4Press platform.
Data correspond to usage on the plateform after 2015. The current usage metrics is available 48-96 hours after online publication and is updated daily on week days.
Initial download of the metrics may take a while.