Fig. 7
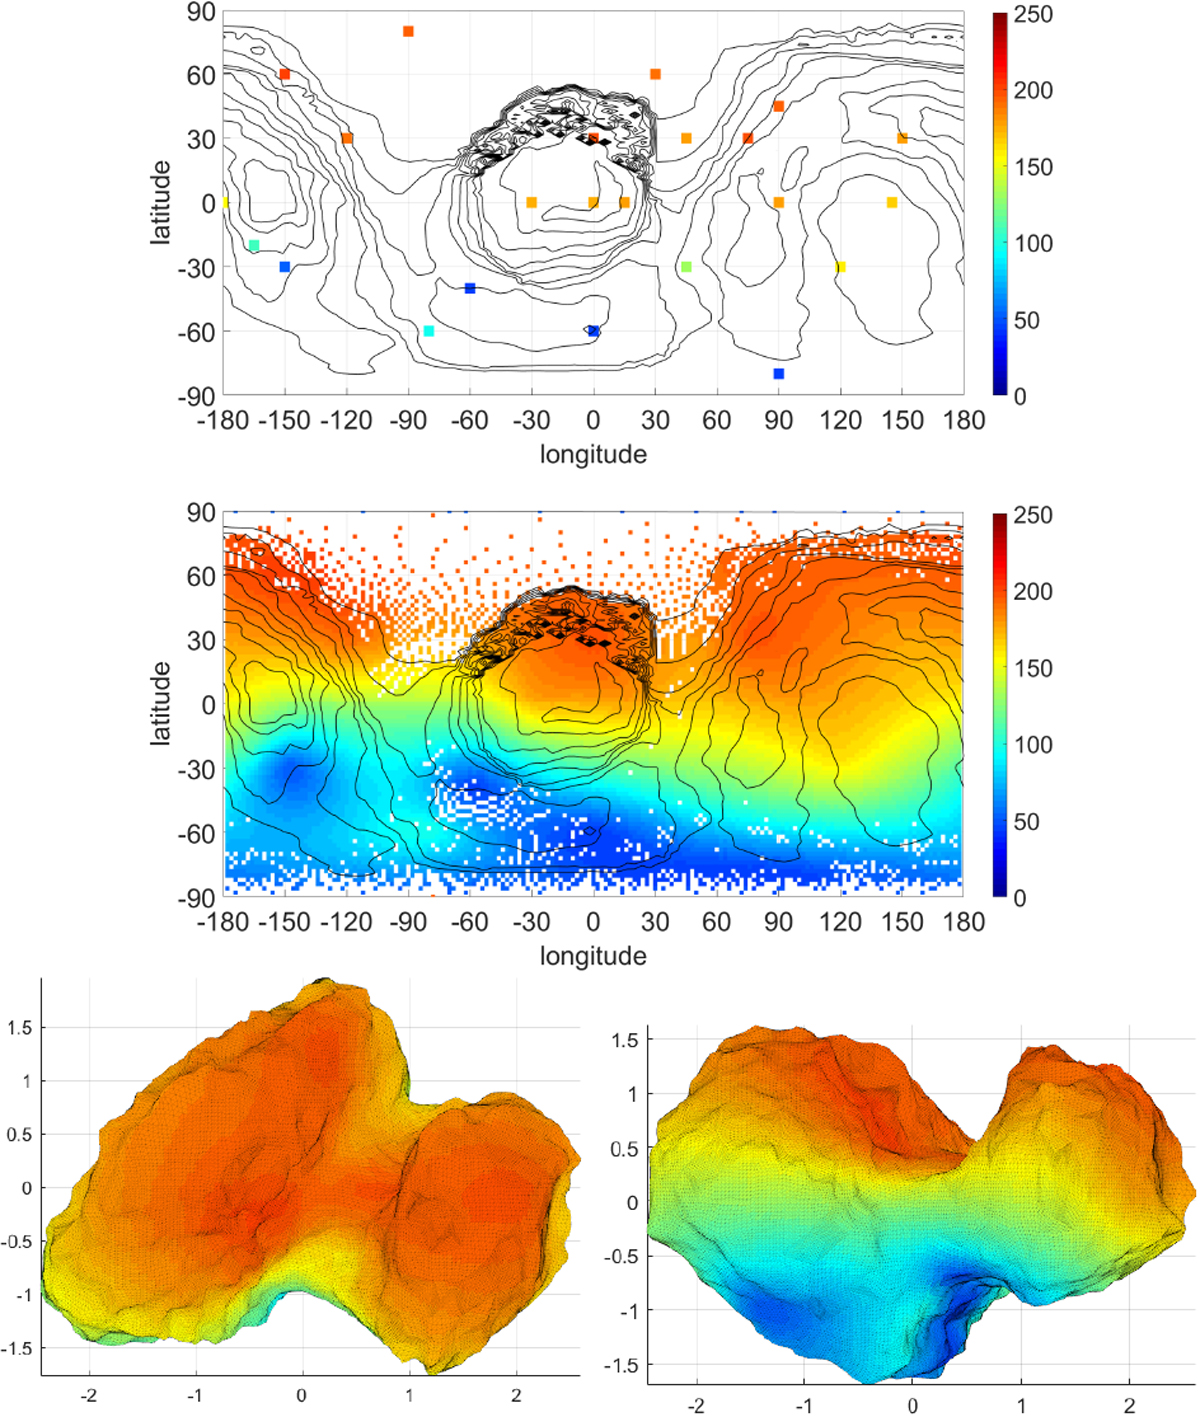
Example maps of interpolated surface temperature [K] using the Green’s functions for splines in tension. We show a map of the 24 studied locations (top), a 2D visualisation (middle), where the white facets are due to the non-convex shape of the nucleus, and a visualisation in which the locations are projected onto a 3D shape (bottom figures) after interpolation over all the surface regions. Topography lines are overplotted on the maps in black based on the 3D shape model provided by European Space Agency/Rosetta/MPS for the OSIRIS team. In this example, colours represent the surface temperature of the nucleus at around 3.3 au.
Current usage metrics show cumulative count of Article Views (full-text article views including HTML views, PDF and ePub downloads, according to the available data) and Abstracts Views on Vision4Press platform.
Data correspond to usage on the plateform after 2015. The current usage metrics is available 48-96 hours after online publication and is updated daily on week days.
Initial download of the metrics may take a while.