Open Access
Fig. 6
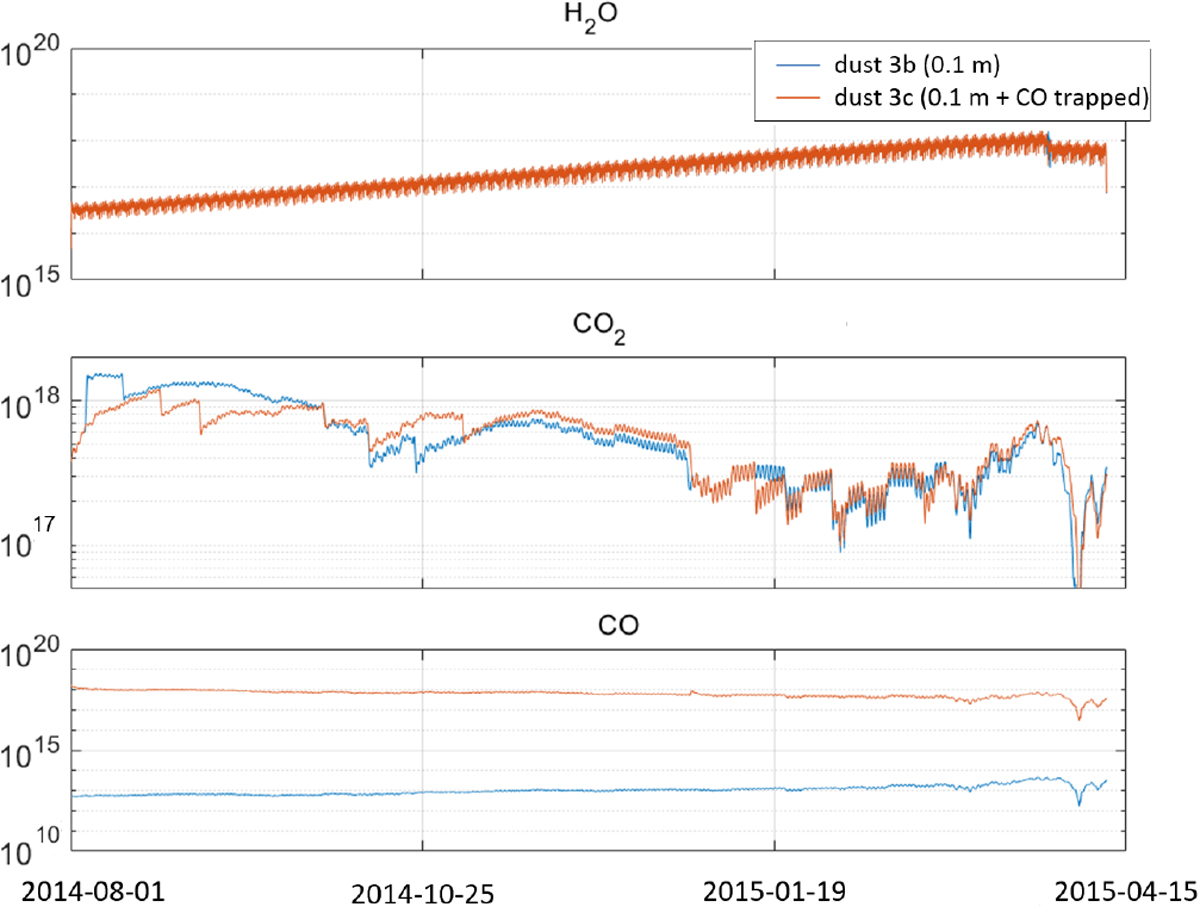
Evolution of fluxes from point 1 (45°, 30°), for H2O (top), CO2 (middle), and CO (bottom), in case dust 3b (no trapped CO) and case dust 3c (presence of trapped CO), from about 3.45 to 2.3 au. A 10 cm dust layer is imposed in the northern hemisphere for both cases.
Current usage metrics show cumulative count of Article Views (full-text article views including HTML views, PDF and ePub downloads, according to the available data) and Abstracts Views on Vision4Press platform.
Data correspond to usage on the plateform after 2015. The current usage metrics is available 48-96 hours after online publication and is updated daily on week days.
Initial download of the metrics may take a while.