Open Access
Fig. 4
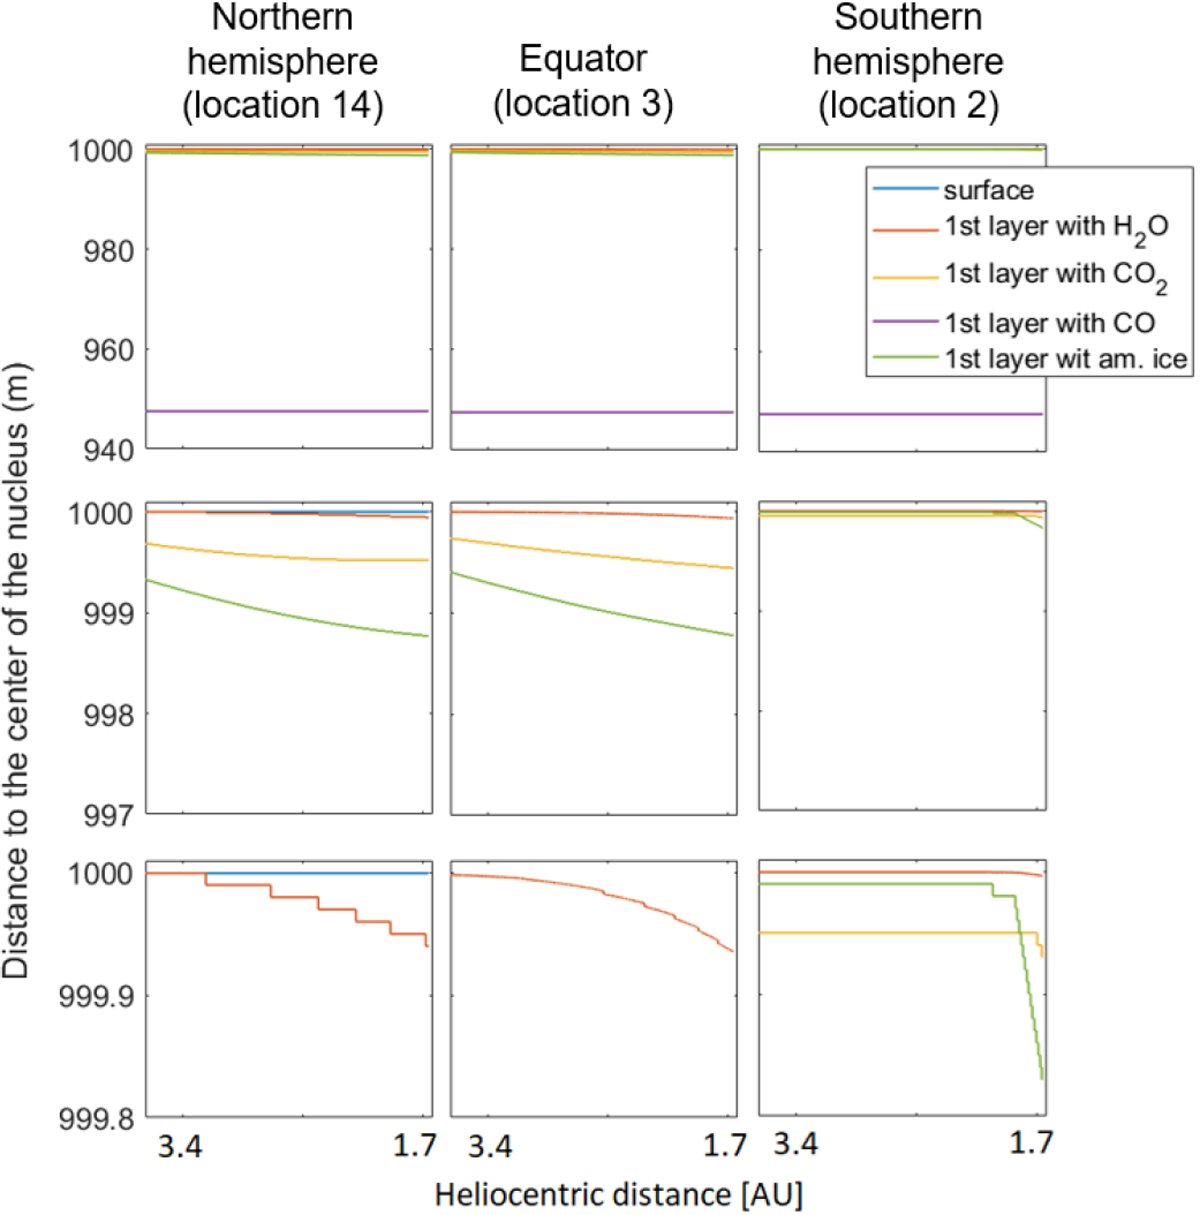
Evolution of the stratification for three locations: in the northern hemisphere (left), at the equator (middle), and in the southern hemisphere (right). The second and the third lines are zooms of the first line.
Current usage metrics show cumulative count of Article Views (full-text article views including HTML views, PDF and ePub downloads, according to the available data) and Abstracts Views on Vision4Press platform.
Data correspond to usage on the plateform after 2015. The current usage metrics is available 48-96 hours after online publication and is updated daily on week days.
Initial download of the metrics may take a while.