Fig. 2
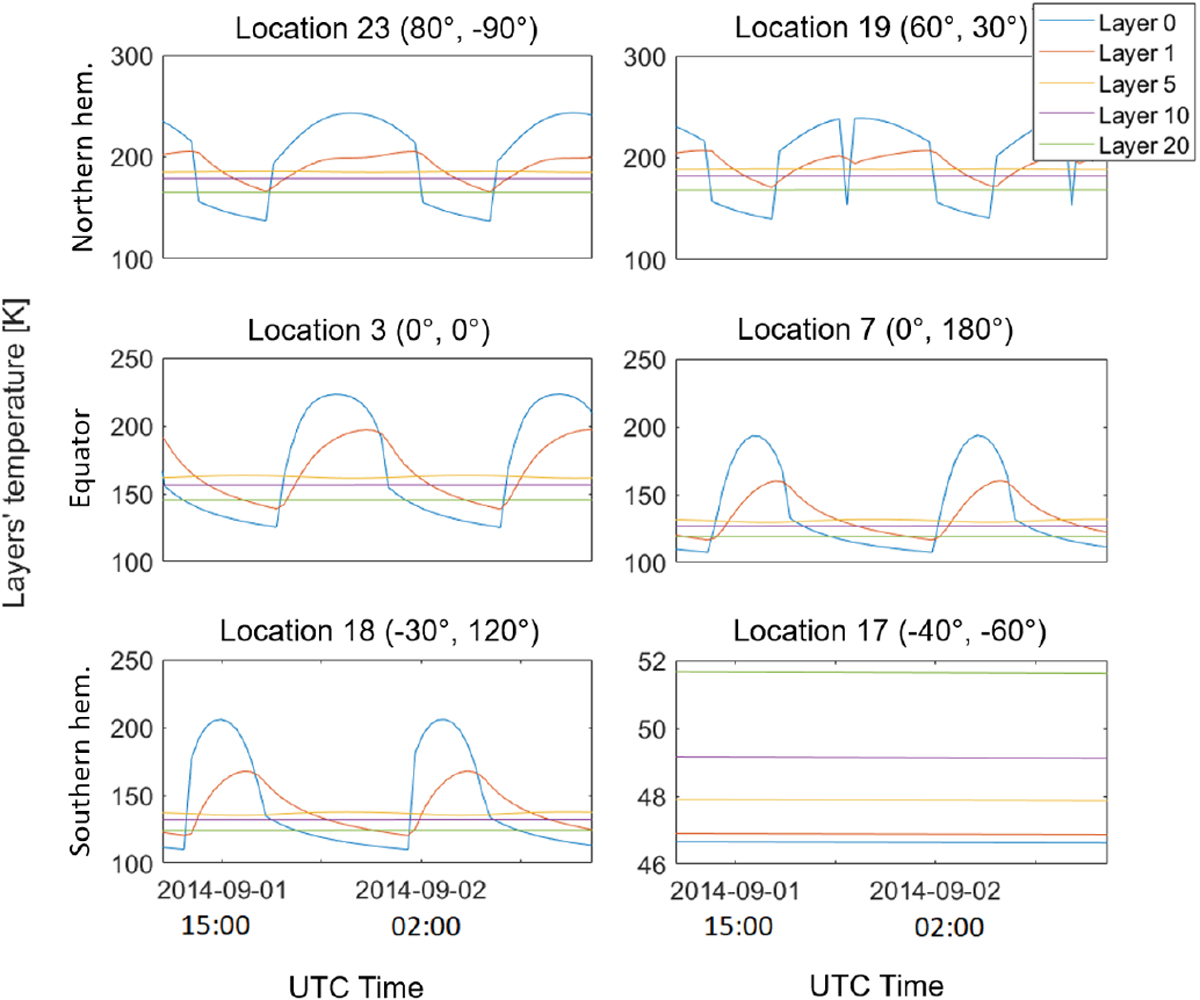
Evolution of the temperature at different depths for six chosen locations, over two rotations at a heliocentric distance of 3.4 au. The first line shows locations in the northern hemisphere, the second line shows the locations of the equator, and the third line the locations in the southern hemisphere. Layer 0 represents the surface, layer 1 is at a depth of 1 cm, layer 5 is at 5 cm, layer 10 is at 10 cm, and layer 20 is at 20 cm.
Current usage metrics show cumulative count of Article Views (full-text article views including HTML views, PDF and ePub downloads, according to the available data) and Abstracts Views on Vision4Press platform.
Data correspond to usage on the plateform after 2015. The current usage metrics is available 48-96 hours after online publication and is updated daily on week days.
Initial download of the metrics may take a while.