Open Access
Fig. 13
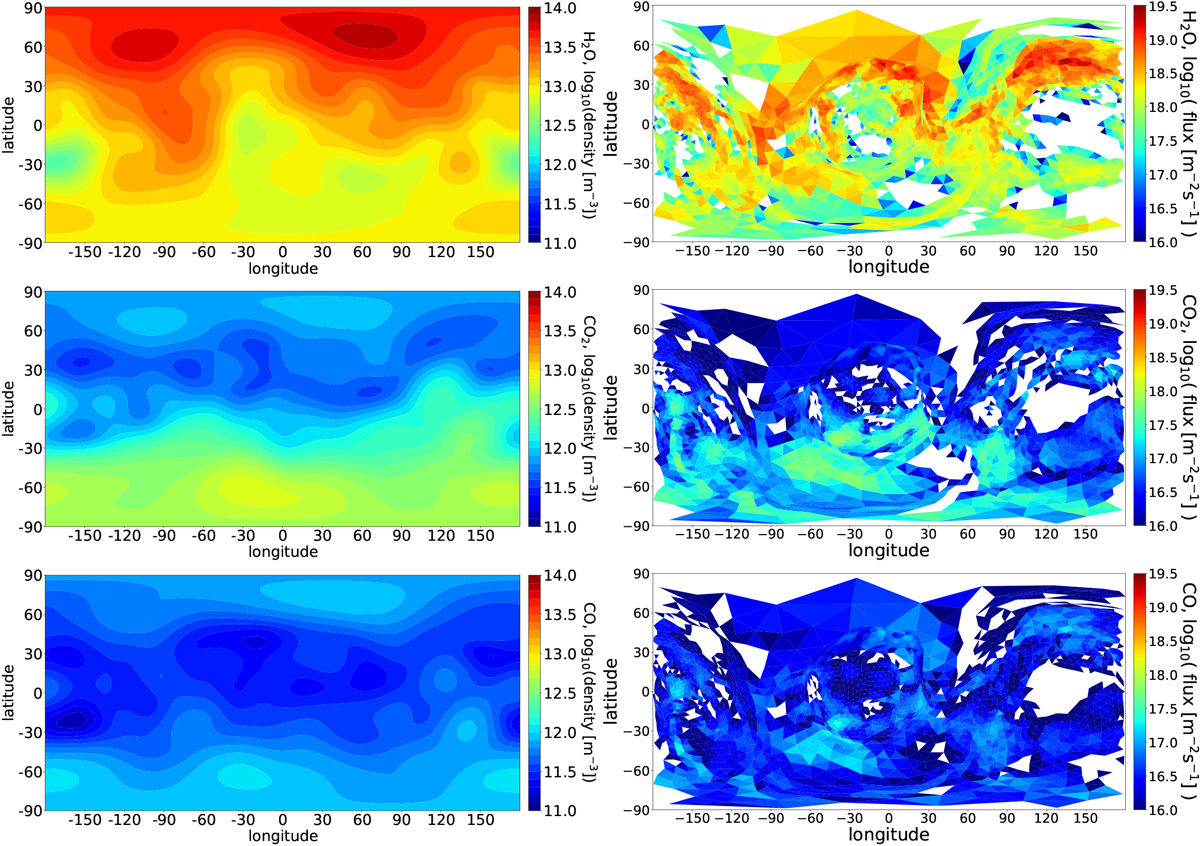
Inverse model applied to the COPS/DFMS measurements between 11 January 2015 and 5 February 2015 in Period B. Left column: density distribution on a 30 km sphere. Right column: surface flux. Rows: H2O, CO2, and CO; white areas indicate missing coverage.
Current usage metrics show cumulative count of Article Views (full-text article views including HTML views, PDF and ePub downloads, according to the available data) and Abstracts Views on Vision4Press platform.
Data correspond to usage on the plateform after 2015. The current usage metrics is available 48-96 hours after online publication and is updated daily on week days.
Initial download of the metrics may take a while.