Fig. 9.
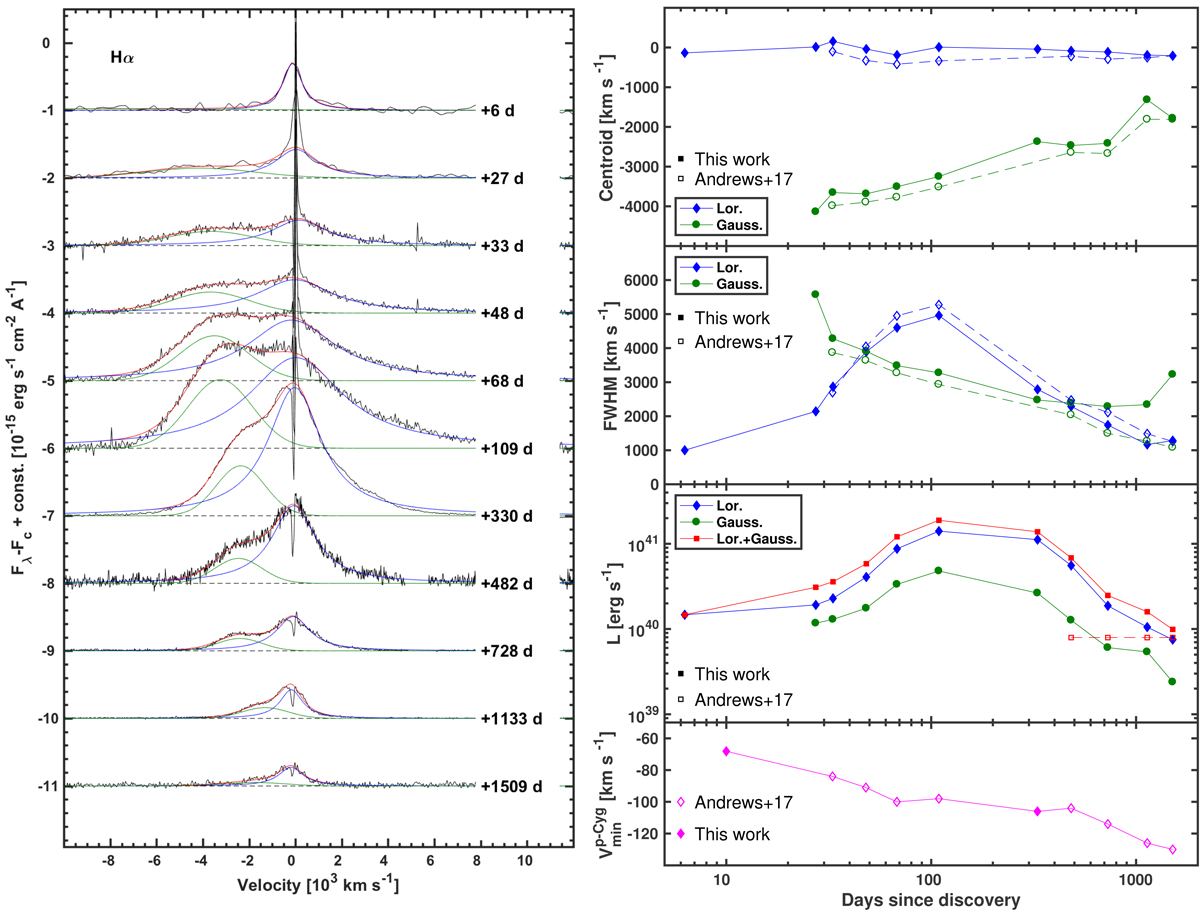
Left panel: continuum-subtracted and extinction corrected Hα profiles (black) fitted by a sum of a Lorentzian (blue) and a Gaussian (green) function to reproduce the broad components. The total fit is shown in red. The spectral phases are shown on the right next to each spectrum. The wavelength range around the narrow component was excluded from the fit. Right panel: velocities and luminosities of the Hα components. The centroid and the FWHM of the Gaussian and of the Lorentzian are shown in the top panels, their luminosities and the total luminosity, as well as the velocities of the narrow component are shown in the bottom panels. Here for the narrow component, we considered the velocity of the absorption minimum assuming zero velocity corresponding to the emission peak, such as in A17. We report our results as well as those of A17 to show the close agreement.
Current usage metrics show cumulative count of Article Views (full-text article views including HTML views, PDF and ePub downloads, according to the available data) and Abstracts Views on Vision4Press platform.
Data correspond to usage on the plateform after 2015. The current usage metrics is available 48-96 hours after online publication and is updated daily on week days.
Initial download of the metrics may take a while.