Fig. 8.
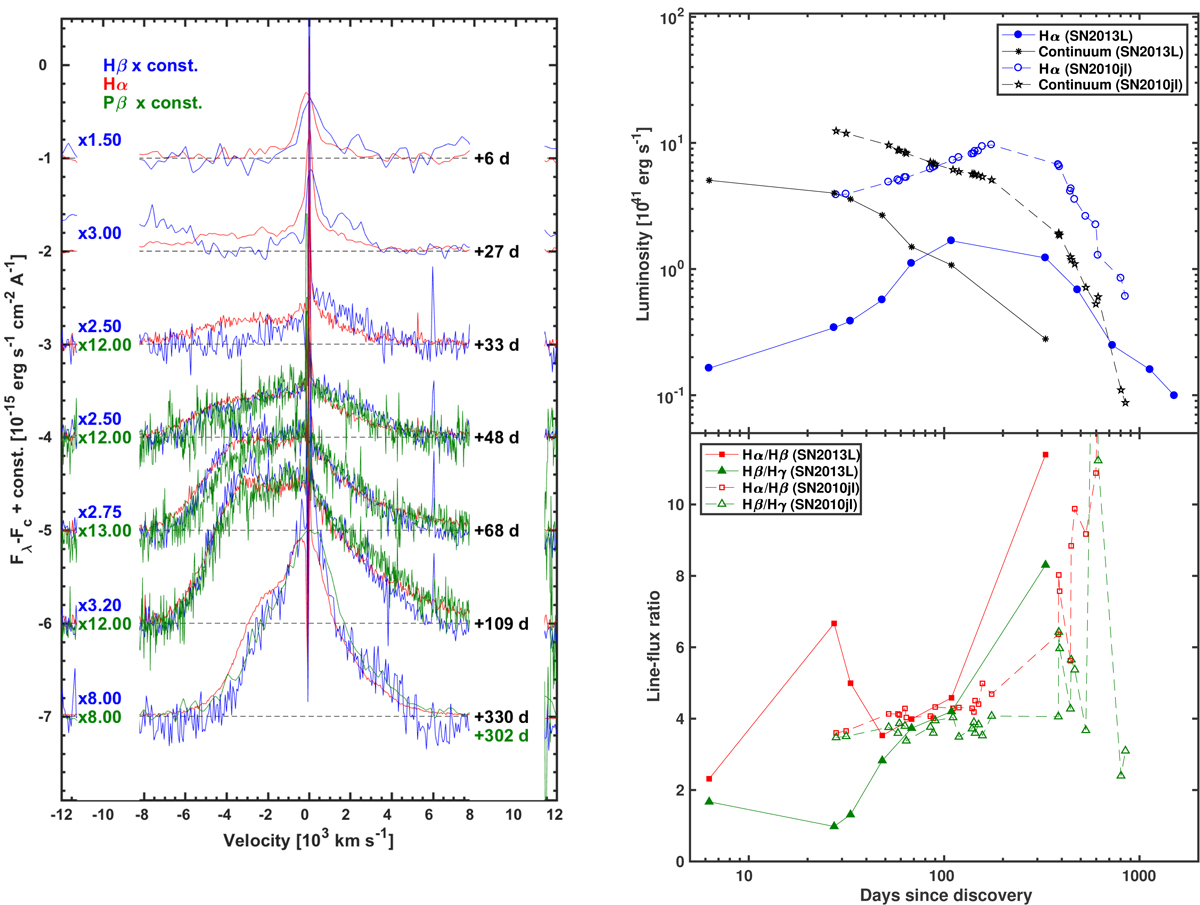
Left panel: Hα, Hβ, and Pβ line profiles compared to one another and plotted in velocity space. Each line has been corrected for extinction and continuum subtracted. Hβ and Pβ lines were scaled by the constants indicated on the left to match the intensity of Hα. The spectral phases in days since discovery are reported on the right. The shape of the line profiles is remarkably similar at all epochs. Top-right panel: Hα luminosity and continuum luminosity in the Hα region as a function of time for SN 2013L and SN 2010jl (Fransson et al. 2014). Bottom-right panel: Hα/Hβ and Hβ/Hγ flux ratio as a function of time for SN 2013L and SN 2010jl.
Current usage metrics show cumulative count of Article Views (full-text article views including HTML views, PDF and ePub downloads, according to the available data) and Abstracts Views on Vision4Press platform.
Data correspond to usage on the plateform after 2015. The current usage metrics is available 48-96 hours after online publication and is updated daily on week days.
Initial download of the metrics may take a while.