Fig. 7.
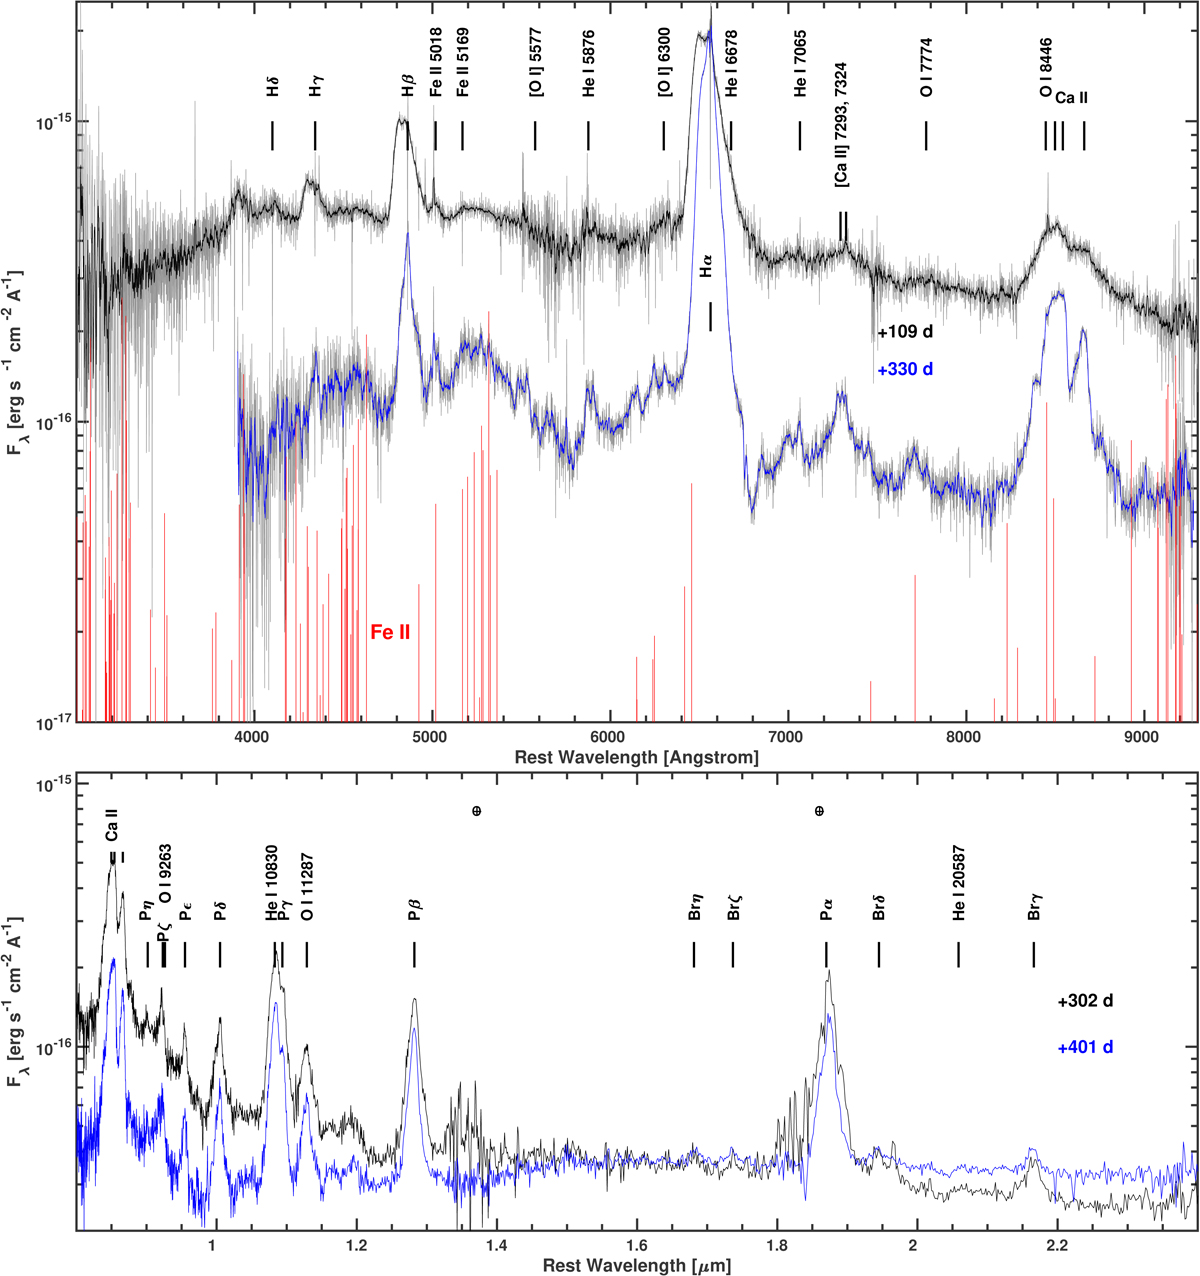
Visual (top) and NIR (bottom) spectral line identifications for SN 2013L. It is important to note that the spectra in the top panel were smoothed (dark lines) for presentation purposes. In the optical, we plotted the expected positions for the Fe II lines (red) for a model with Fe II Lyα and Lyβ pumping, from Sigut & Pradhan (2003). These lines can explain the blue excess in the spectrum at late epochs.
Current usage metrics show cumulative count of Article Views (full-text article views including HTML views, PDF and ePub downloads, according to the available data) and Abstracts Views on Vision4Press platform.
Data correspond to usage on the plateform after 2015. The current usage metrics is available 48-96 hours after online publication and is updated daily on week days.
Initial download of the metrics may take a while.