Fig. 4.
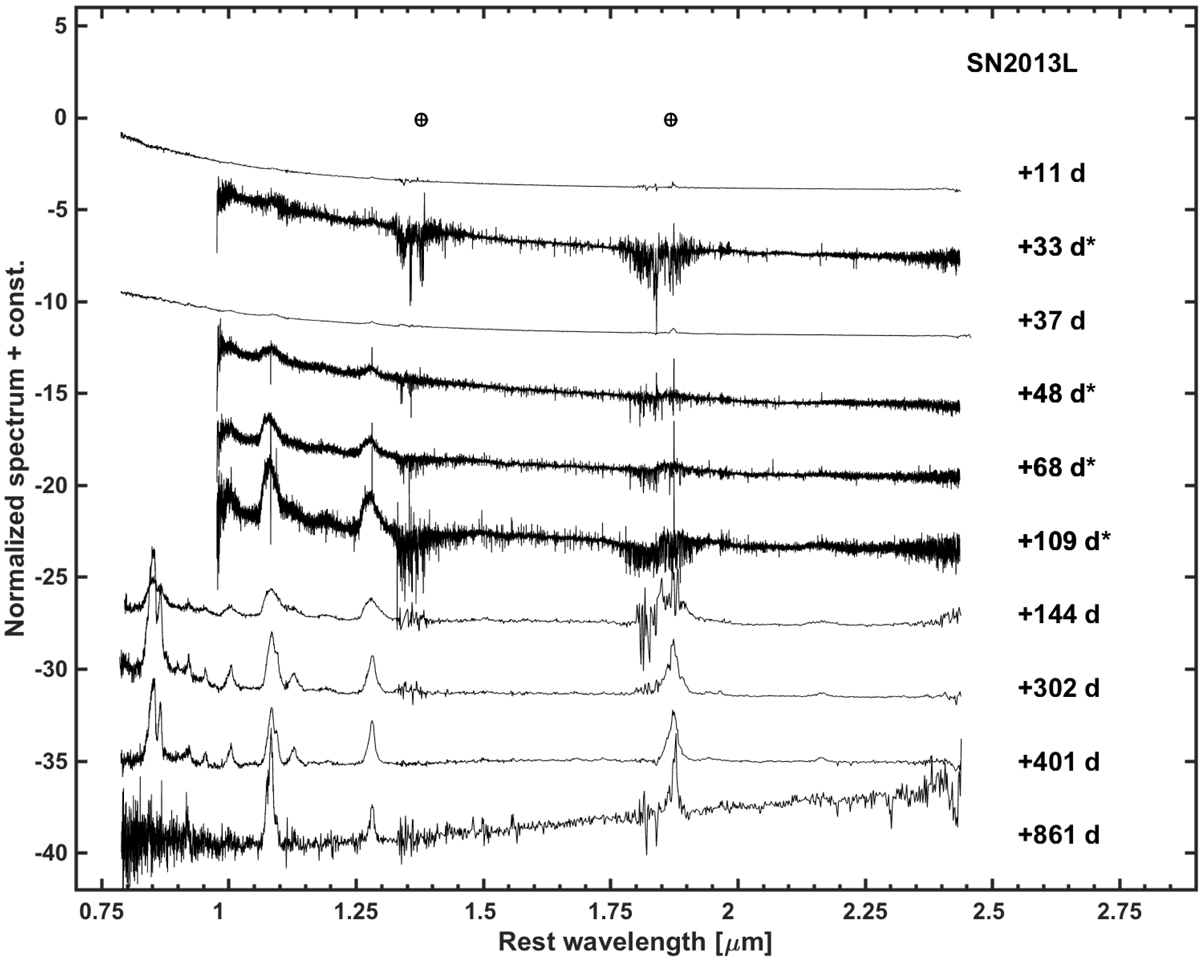
NIR spectroscopic time-series of SN 2013L obtained with FIRE and X-shooter. The phase of each spectrum relative to discovery is indicated next to each spectrum. The spectra that were already published in Andrews et al. (2017) are marked by a star next to their phases. Each spectrum was normalized by its median and shifted by a constant for a better visualization. We marked the telluric bands at the top.
Current usage metrics show cumulative count of Article Views (full-text article views including HTML views, PDF and ePub downloads, according to the available data) and Abstracts Views on Vision4Press platform.
Data correspond to usage on the plateform after 2015. The current usage metrics is available 48-96 hours after online publication and is updated daily on week days.
Initial download of the metrics may take a while.