Fig. 22.
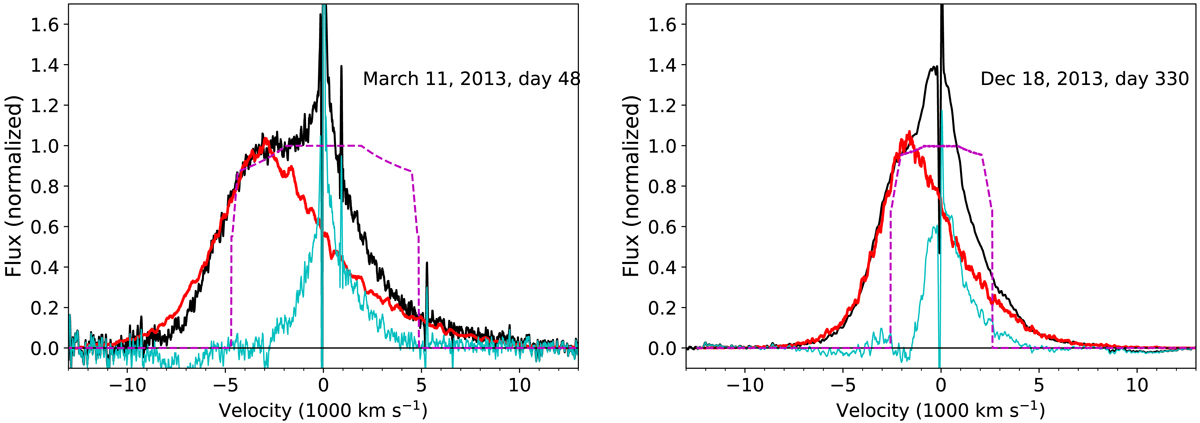
Continuum subtracted Hα line (shown in black) from days 48 (left) and 330 (right) together with the electron scattering profiles from the model with Hα emission only from the ejecta and shocked region (red). The dashed magenta lines show the box-like input emission profiles from a radially thin shell with velocity 4800 km s−1 and 2700 km s−1, respectively. The cyan lines show the residual between the model and the observed profile. Electron scattering and occultation by the photosphere result in the smooth, blue-shifted profile. We note the central excess from the models, indicating a different component.
Current usage metrics show cumulative count of Article Views (full-text article views including HTML views, PDF and ePub downloads, according to the available data) and Abstracts Views on Vision4Press platform.
Data correspond to usage on the plateform after 2015. The current usage metrics is available 48-96 hours after online publication and is updated daily on week days.
Initial download of the metrics may take a while.