Fig. 2.
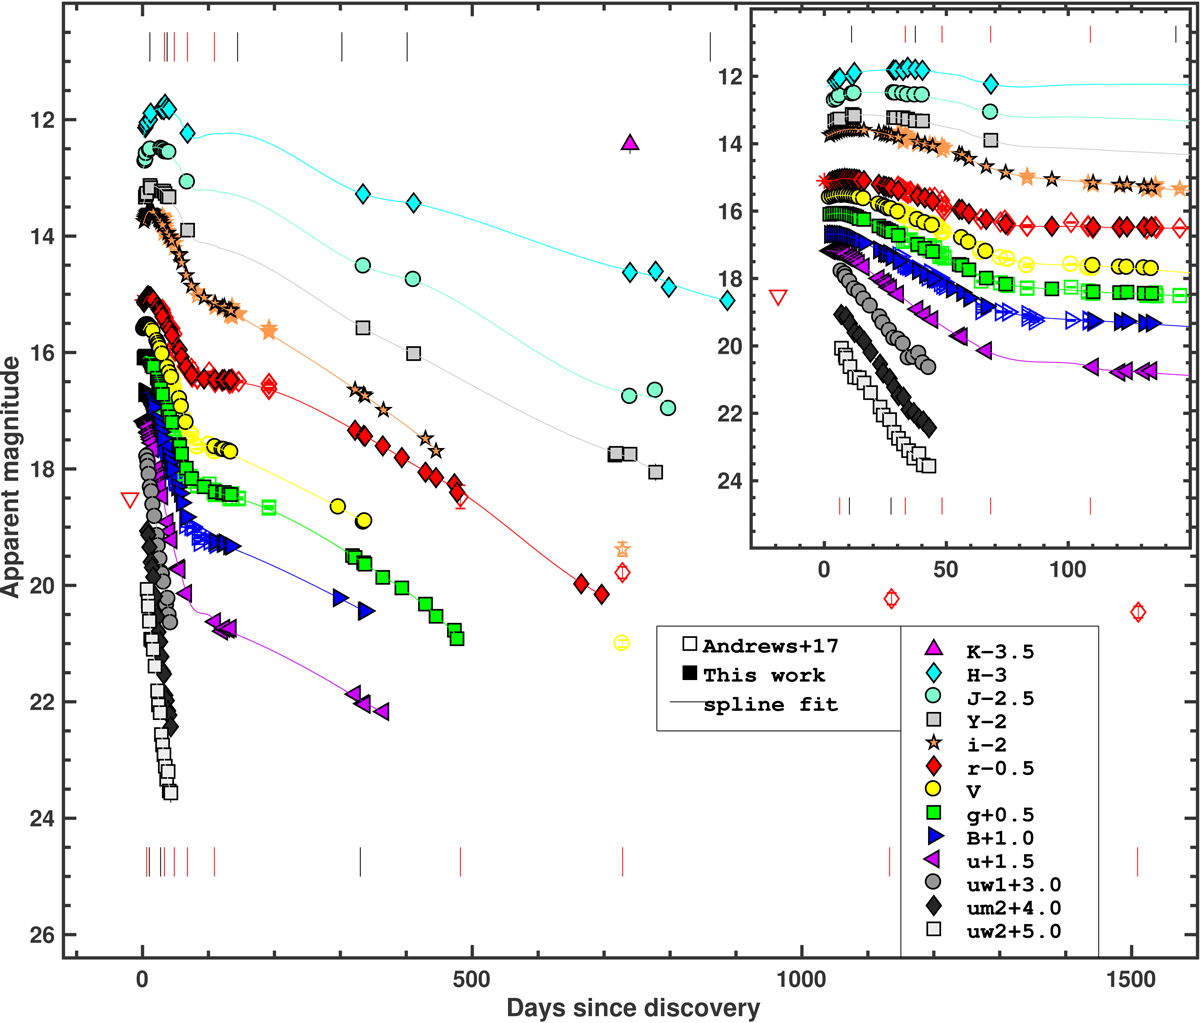
CSP-II uBgVriYJHKs-band and Swiftuvw2, uvm2, uvw1-band light curves of SN 2013L (filled symbols). Light curves were shifted for clarity by the amounts shown in the legend. The photometry is also included from A17 (open symbols). Solid lines correspond to tension spline fits to the CSP-II photometry. Epochs of spectral observations are indicated with vertical segments (NIR spectra at the top and optical spectra at the bottom; in black our new spectra, in red those already published by A17). The nondetection limit in an unfiltered/r band is indicated by a red triangle, while unfiltered/r band discovery and confirmation magnitudes are shown by red stars. The top-right inset shows a zoomed in view of the light curves over the first 150 days of evolution.
Current usage metrics show cumulative count of Article Views (full-text article views including HTML views, PDF and ePub downloads, according to the available data) and Abstracts Views on Vision4Press platform.
Data correspond to usage on the plateform after 2015. The current usage metrics is available 48-96 hours after online publication and is updated daily on week days.
Initial download of the metrics may take a while.