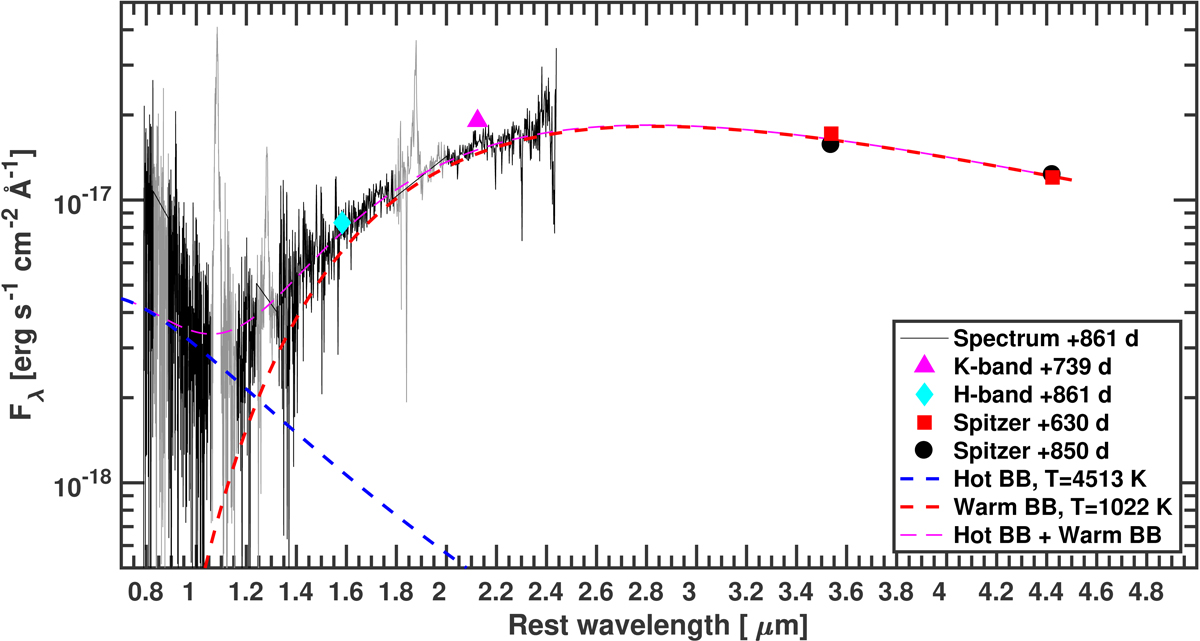
Fig. 19.

Late phase Ks-band and Spitzer photometry converted into monochromatic fluxes plotted together with our last epoch NIR spectrum. The SED exhibits a strong NIR and MIR excess that dominates the SN emission two years after discovery. The NIR spectrum was scaled to match the Ks-band flux. We fit a sum of two BB functions (magenta dashed line) to reproduce the NIR spectrum and the MIR fluxes from the first Spitzer epoch. The warm BB component (red dashed line) dominating the NIR and MIR has a temperature of 1022 K and the hot component (blue dashed line) has a temperature of 4513 K.
Current usage metrics show cumulative count of Article Views (full-text article views including HTML views, PDF and ePub downloads, according to the available data) and Abstracts Views on Vision4Press platform.
Data correspond to usage on the plateform after 2015. The current usage metrics is available 48-96 hours after online publication and is updated daily on week days.
Initial download of the metrics may take a while.


