Fig. 18.
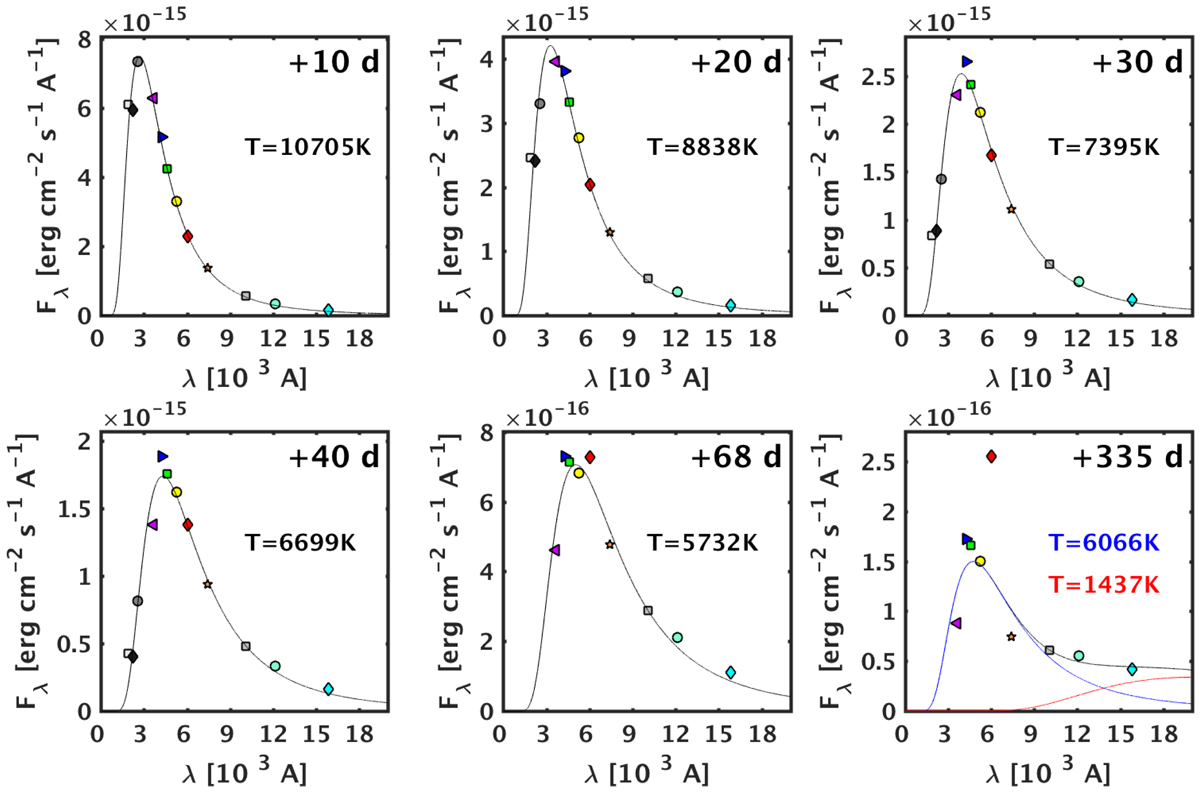
Example of SEDs of SN 2013L with the specific epochs corresponding to times when NIR photometry is available. Each flux point was obtained by converting the magnitudes into fluxes after having applied the appropriate extinction correction. The color and symbol code for each band is the same as in Fig. 2. A single BB function was fit to each SED until +68 d (black line), while a sum of two BB functions was used to fit the +335 d SED in order to reproduce the NIR excess (red line) and the optical BB shape (blue line). The r band is not included in the fit due to the prevalent Hα emission. The BB temperature is reported in each subpanel as well as the phase of the SED.
Current usage metrics show cumulative count of Article Views (full-text article views including HTML views, PDF and ePub downloads, according to the available data) and Abstracts Views on Vision4Press platform.
Data correspond to usage on the plateform after 2015. The current usage metrics is available 48-96 hours after online publication and is updated daily on week days.
Initial download of the metrics may take a while.