Fig. 12.
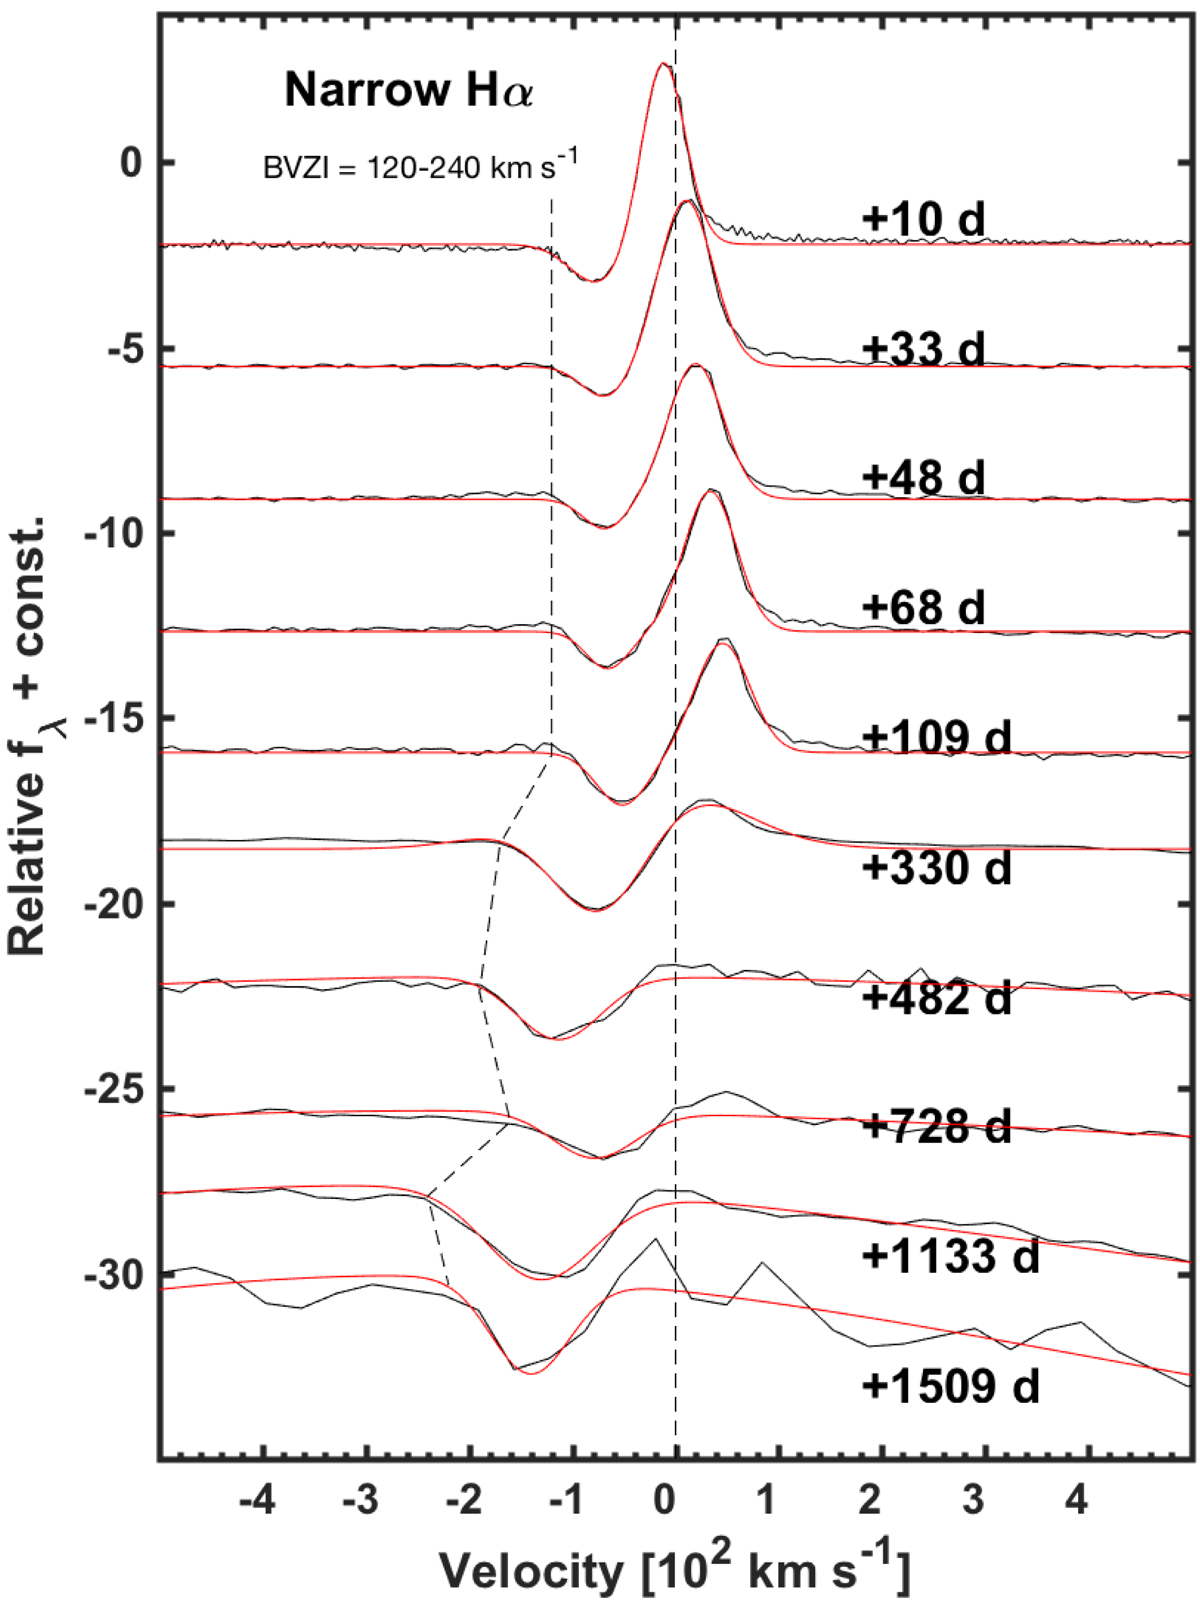
Narrow component of Hα plotted in velocity space. The spectral phases in days since discovery are reported on the right. The zero velocity was chosen to correspond to 6562.8 Å in the rest frame. We plotted (in red) the best fit to the line profile, which was achieved by fitting two Gaussian components, one for the absorption and one for the emission. The emission dominates at early epochs, while absorption becomes stronger at later epochs. We marked the BVZI with a dashed segmented line that ranges from −120 to −240 km s−1.
Current usage metrics show cumulative count of Article Views (full-text article views including HTML views, PDF and ePub downloads, according to the available data) and Abstracts Views on Vision4Press platform.
Data correspond to usage on the plateform after 2015. The current usage metrics is available 48-96 hours after online publication and is updated daily on week days.
Initial download of the metrics may take a while.