Fig. 11.
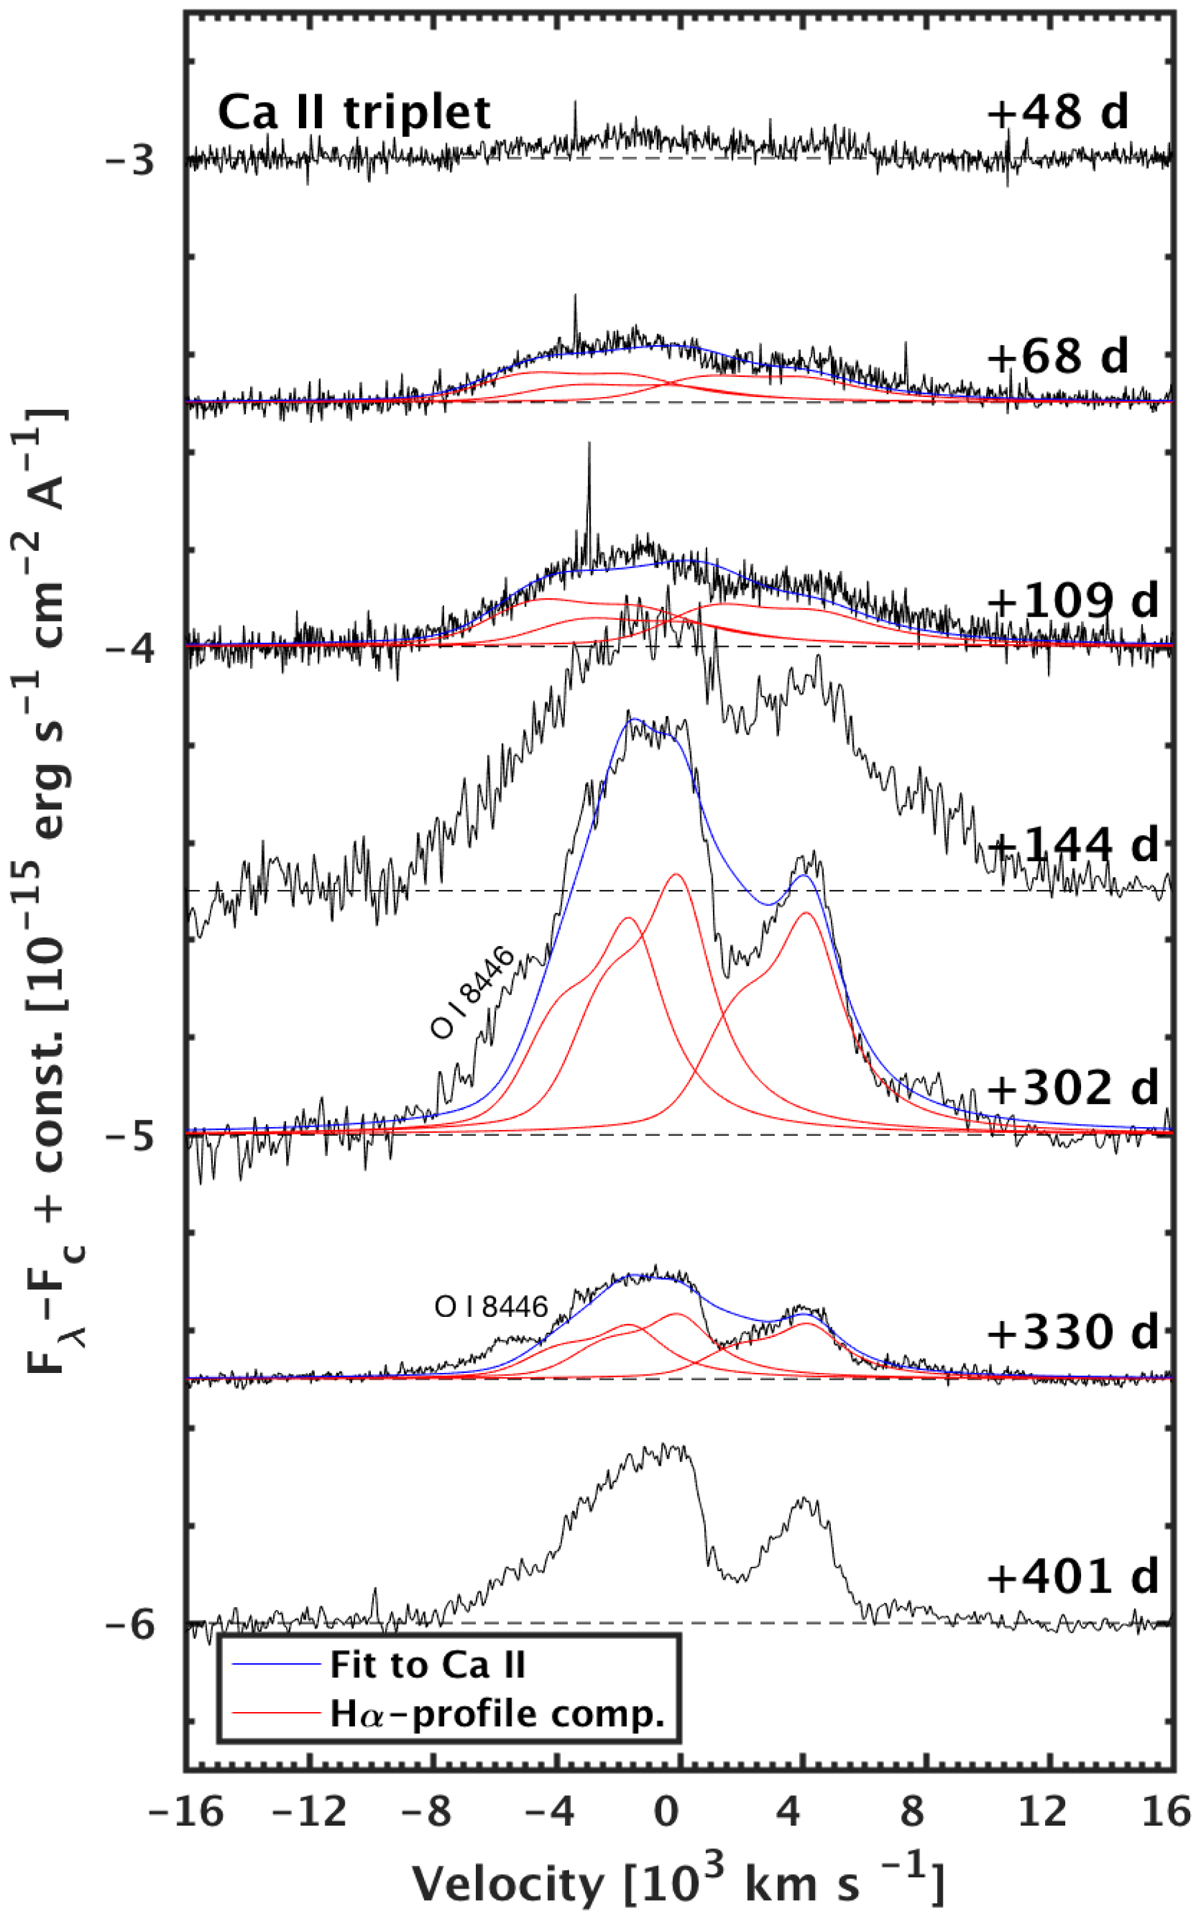
Continuum-subtracted and extinction corrected Ca II triplet profiles (black) fitted by a sum (blue) of three Hα best-fit profiles from Fig. 9 to reproduce the complex line shape. We followed the approach by A17 and confirmed that this is also a good fit for the Ca II triplet at +302 d and +330 d. The spectral phases are shown on the right next to each spectrum. An excess blueward of the best line fit is compatible with the emerging of O I λ8446, but there is also Fe II that can contribute to the flux in that range.
Current usage metrics show cumulative count of Article Views (full-text article views including HTML views, PDF and ePub downloads, according to the available data) and Abstracts Views on Vision4Press platform.
Data correspond to usage on the plateform after 2015. The current usage metrics is available 48-96 hours after online publication and is updated daily on week days.
Initial download of the metrics may take a while.