Fig. 10.
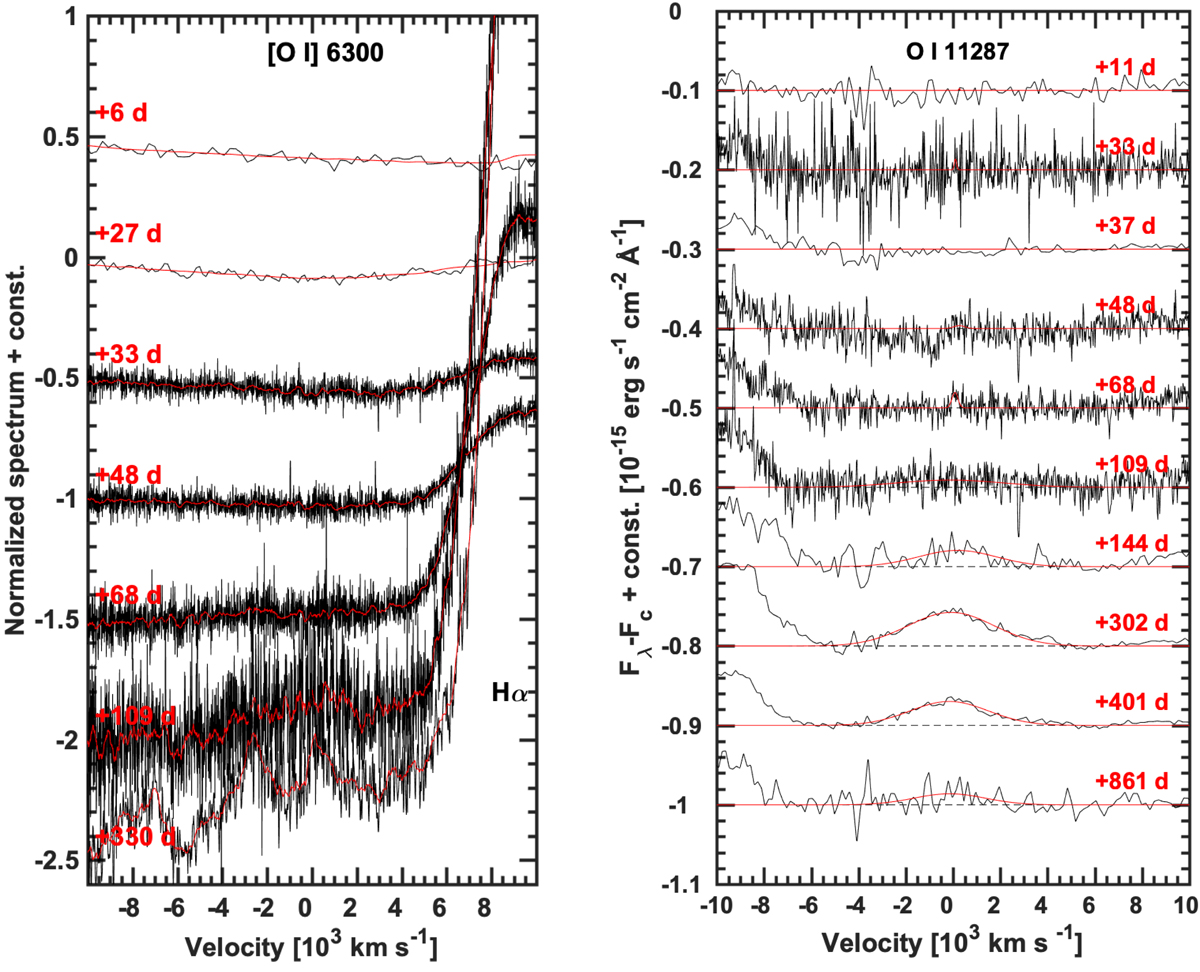
Left panel: normalized spectra in velocity space around the [O I] λ6300 wavelength regions. The original spectrum in black and the smoothed spectrum in red are shown to better guide the eye to follow the line profile evolution. The spectral phases are reported in red next to each spectrum. The emergence of the oxygen line at 6300 Å at late epochs is evident. We note that the line at −3000 km s−1 is Fe II. Right panel: continuum subtracted and extinction corrected spectra in velocity space around the wavelength region of O I λ11827. This line appears at late epochs and it is well fit by a single Gaussian profile of ∼4000 km s−1 FWHM (shown in red). The phases of each spectrum are reported next to them.
Current usage metrics show cumulative count of Article Views (full-text article views including HTML views, PDF and ePub downloads, according to the available data) and Abstracts Views on Vision4Press platform.
Data correspond to usage on the plateform after 2015. The current usage metrics is available 48-96 hours after online publication and is updated daily on week days.
Initial download of the metrics may take a while.