Fig. 3.
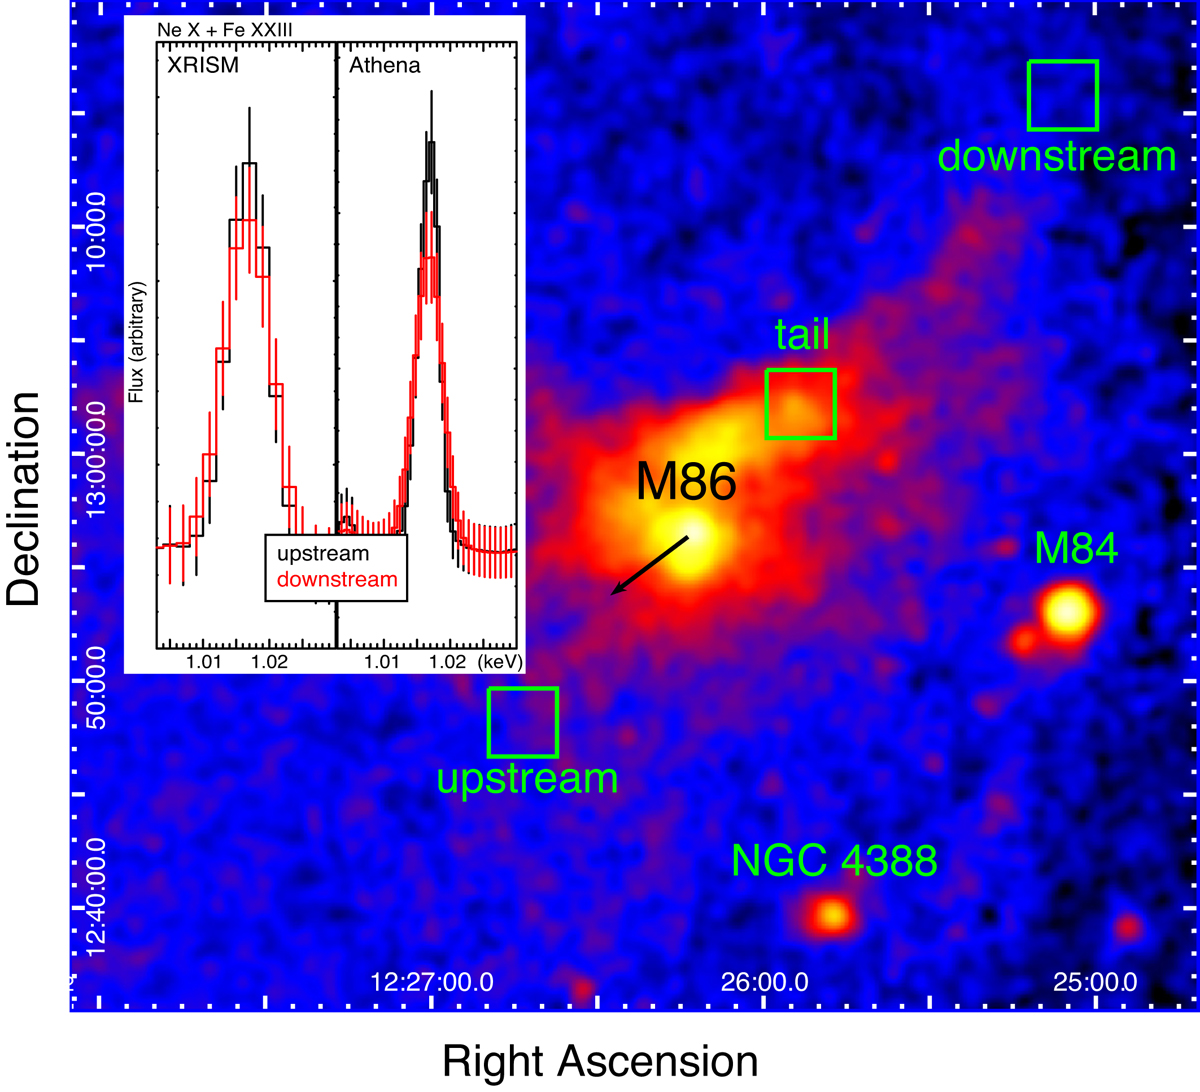
Image by ROSAT of M 86 region. The approximate direction of M 86 motion is denoted by a black arrow. The green boxes show the field of views of the simulated XRISM/Athena spectra for the upstream, tail, and downstream regions. Inset: simulated XRISM (left, 400 ks) and Athena (right, 30 ks) spectra of a narrow band around the blended Ne X and Fe XXIII lines at 1.017 keV. The turbulence in the downstream region (red) is assumed to be 565 km s−1, higher than that in the upstream region (black) by Δσ = 400 km s−1.
Current usage metrics show cumulative count of Article Views (full-text article views including HTML views, PDF and ePub downloads, according to the available data) and Abstracts Views on Vision4Press platform.
Data correspond to usage on the plateform after 2015. The current usage metrics is available 48-96 hours after online publication and is updated daily on week days.
Initial download of the metrics may take a while.