Fig. 2.
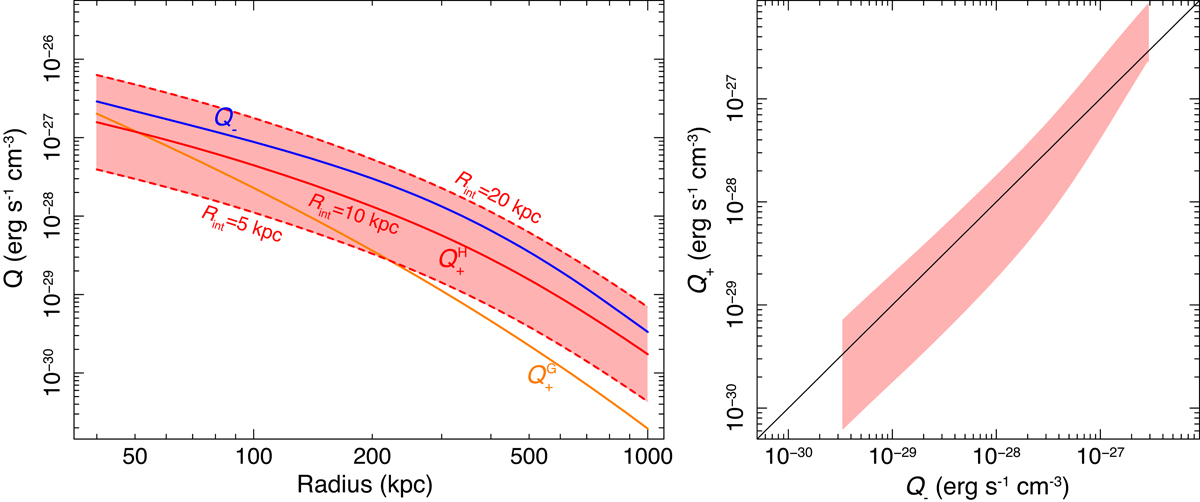
Left panel: radial profiles of the volume cooling rate Q− (blue) and the volume heating rate Q+ from hydrodynamical (red; ![]() ) and g-mode (orange;
) and g-mode (orange; ![]() ) interactions, shown as a function of 3D radius. The shadow region shows the range caused by different hydrodynamical interaction radii, Rint in Eq. (6). Right panel: comparison between Q− and
) interactions, shown as a function of 3D radius. The shadow region shows the range caused by different hydrodynamical interaction radii, Rint in Eq. (6). Right panel: comparison between Q− and ![]() , over various 3D radii. The vertical extent of the shadow region reflects the uncertainty of Rint, as in the left panel. The solid line indicates the exact balance between Q− and Q+.
, over various 3D radii. The vertical extent of the shadow region reflects the uncertainty of Rint, as in the left panel. The solid line indicates the exact balance between Q− and Q+.
Current usage metrics show cumulative count of Article Views (full-text article views including HTML views, PDF and ePub downloads, according to the available data) and Abstracts Views on Vision4Press platform.
Data correspond to usage on the plateform after 2015. The current usage metrics is available 48-96 hours after online publication and is updated daily on week days.
Initial download of the metrics may take a while.