Fig. 4.
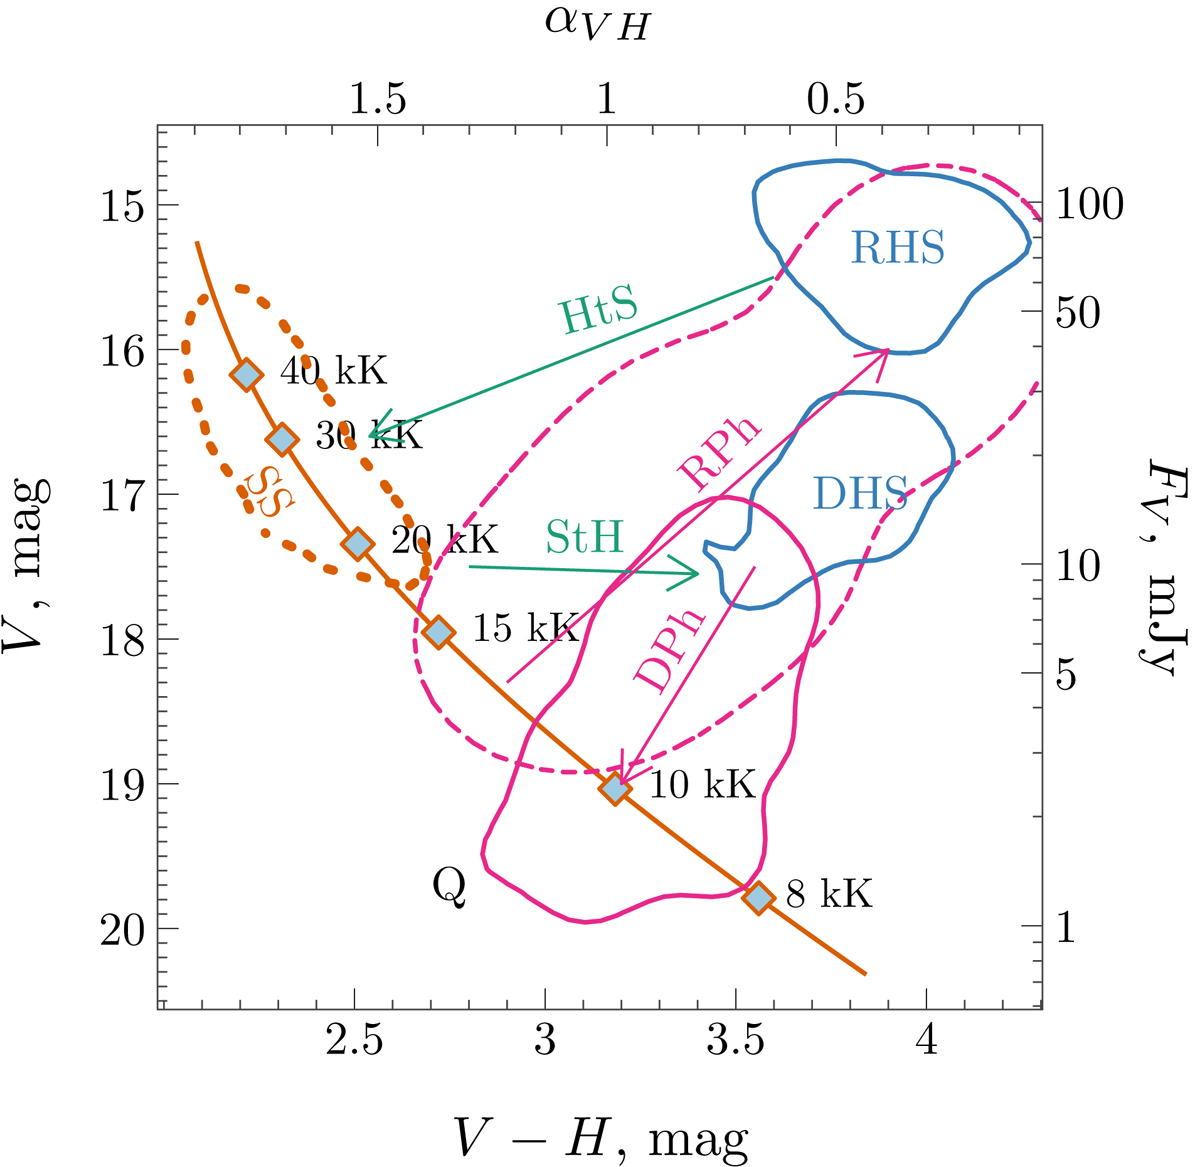
Evolution of magnitudes and colors of GX 339-4 throughout the outburst. V and V − H are observed magnitudes and colors, FV is corrected for the interstellar extinction flux, and αVH is the intrinsic spectral slope, computed assuming AV = 3.58 mag (see Eq. (5)). The dashed pink contour corresponds to the RPh, the top right solid blue contour represents the RHS, the top solid green arrow indicates the HtS transition, dotted orange contour corresponds to the SS, the bottom solid green arrow represents the reverse StH transition, the bottom solid blue contour indicates the DHS, and the solid pink contour corresponds to the DPh. The solid orange line gives the model blackbody curve with log10Nbb = 4.09, see Eq. (1) and the filled blue diamonds along the curve correspond to the temperatures marked on the right. The quiescent state is denoted with letter Q in the lower part of the diagram.
Current usage metrics show cumulative count of Article Views (full-text article views including HTML views, PDF and ePub downloads, according to the available data) and Abstracts Views on Vision4Press platform.
Data correspond to usage on the plateform after 2015. The current usage metrics is available 48-96 hours after online publication and is updated daily on week days.
Initial download of the metrics may take a while.