Fig. 16.
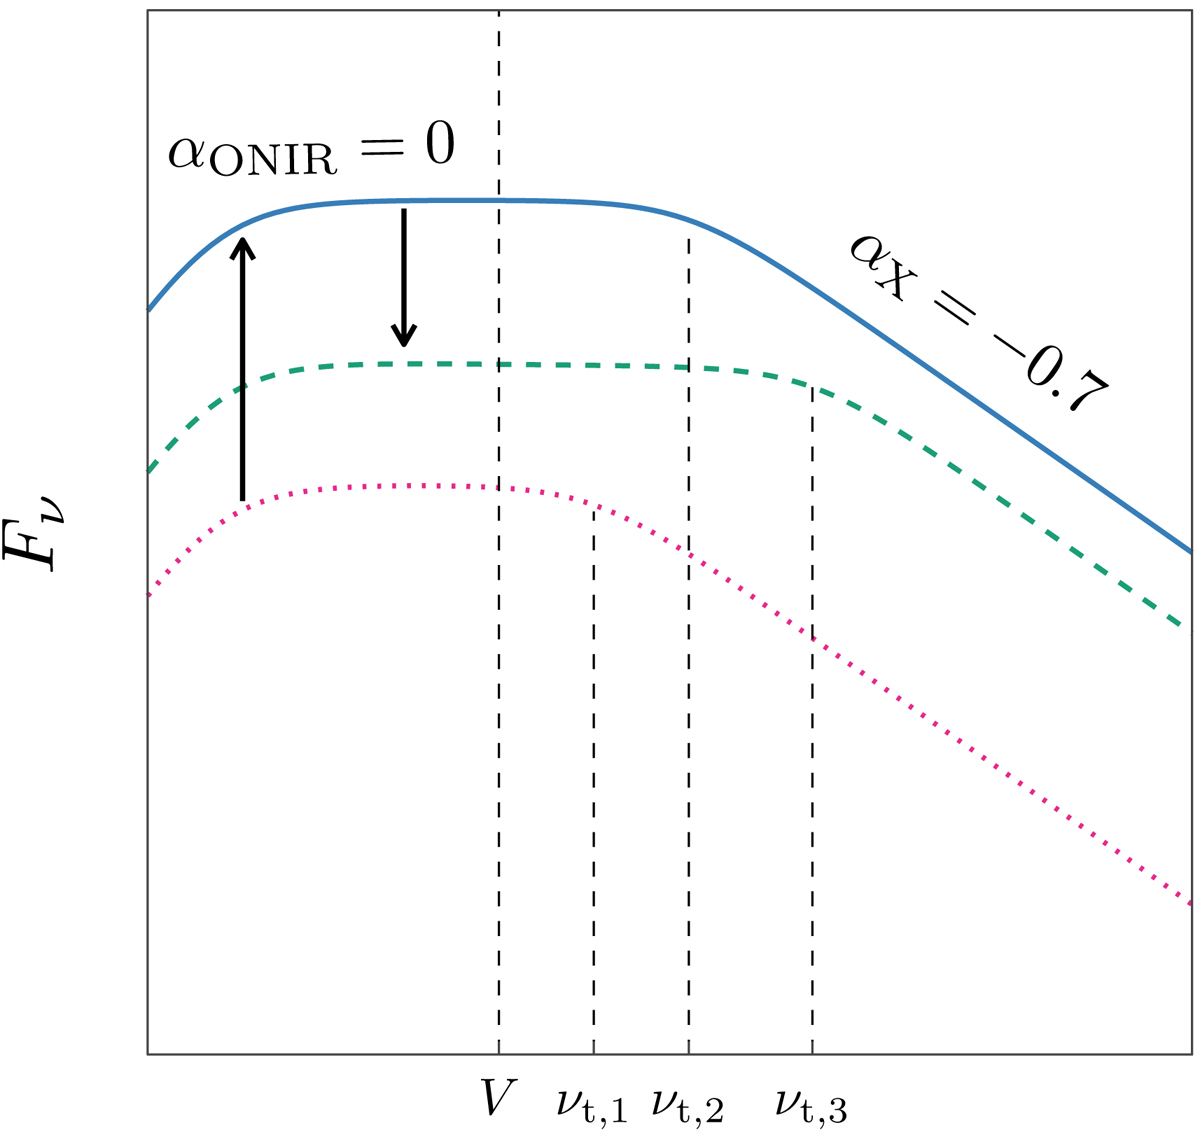
Schematic representation of the evolution of GX 339-4 spectra during the rising phase hard state and HtS transition of an outburst. The dotted pink line indicates the RPh hard spectrum, the solid blue line corresponds to the RHS, and the dashed green line represents the HtS transition. The vertical black arrows indicate the transition sequence. Characteristic turnover frequency of each spectrum and the V filter frequency are shown with the vertical dashed lines. Characteristic spectral slopes in the ONIR and X-ray ranges are shown with αONIR and αX.
Current usage metrics show cumulative count of Article Views (full-text article views including HTML views, PDF and ePub downloads, according to the available data) and Abstracts Views on Vision4Press platform.
Data correspond to usage on the plateform after 2015. The current usage metrics is available 48-96 hours after online publication and is updated daily on week days.
Initial download of the metrics may take a while.