Free Access
Fig. 15.
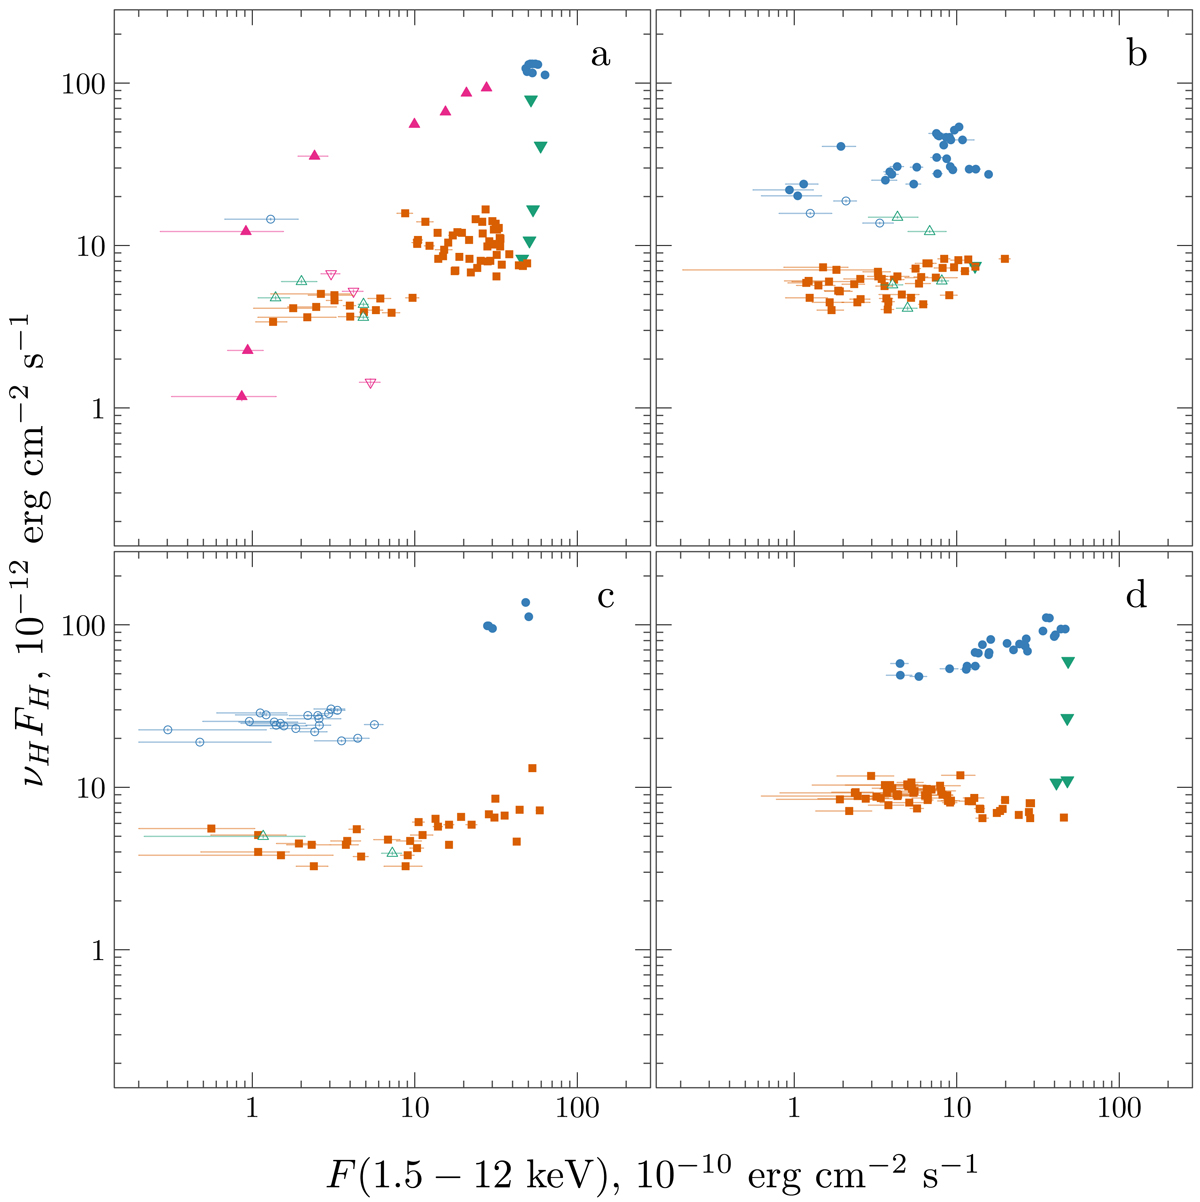
Quasi-simultaneous ONIR νHFH vs. X-ray 1.5−12 keV flux diagram. The X-ray data are taken from all three ASM bands. The colors and symbols are the same as in Fig. 5 and errors are 1σ. 2002–2003 (panel a), 2004–2005 (b), 2007 (c), and 2010–2011 (d) outbursts.
Current usage metrics show cumulative count of Article Views (full-text article views including HTML views, PDF and ePub downloads, according to the available data) and Abstracts Views on Vision4Press platform.
Data correspond to usage on the plateform after 2015. The current usage metrics is available 48-96 hours after online publication and is updated daily on week days.
Initial download of the metrics may take a while.