Fig. 14.
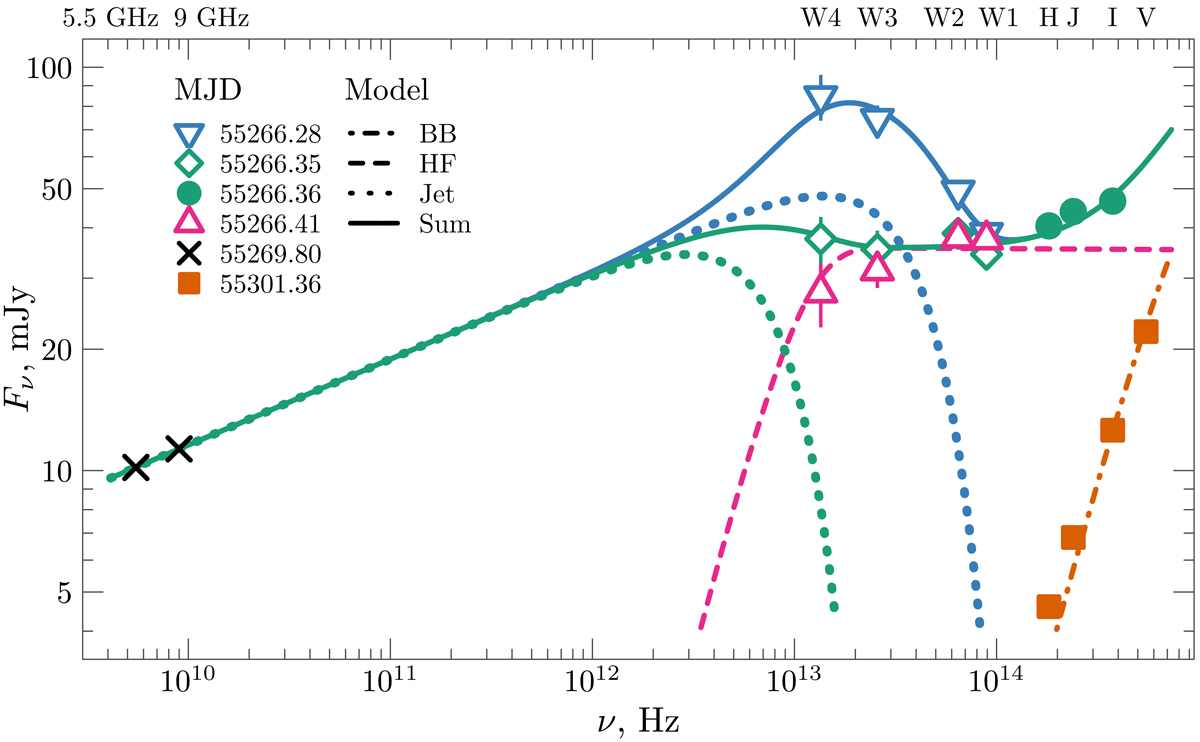
Broadband spectra of GX 339-4 using the radio ATCA, mid-IR WISE, and ONIR SMARTS data. The figure shows four distinct spectral shapes for the source. The orange squares show the soft-state data from MJD 55301.36, the filled green circles and open green diamonds indicate the quasi-simultaneous ONIR and mid-IR data on MJD 55266.35. The open blue downward-facing triangles and open pink upward facing triangles show the mid-IR spectra measured 1.7 h before and after the quasi-simultaneous observation, respectively. The black crosses indicate one of the closest available ATCA radio observations (MJD 55269.80) that is used to constrain the jet properties. The lines show different model components: the dot-dashed orange line indicates the blackbody component, the dashed pink line shows the hot flow component, the dotted lines correspond to the jet model with different cutoff frequencies, and the solid lines give the sum of the three (blackbody + hot flow + jet) components. The sum of the blackbody and hot flow components for MJD 55266.41 is not shown for convenience because it fully coincides with the hot flow curve in the mid-IR. The 1σ errors are comparable with the symbol size. The WISE fluxes are adjusted by the normalization factors inferred from the fit (see Table 6).
Current usage metrics show cumulative count of Article Views (full-text article views including HTML views, PDF and ePub downloads, according to the available data) and Abstracts Views on Vision4Press platform.
Data correspond to usage on the plateform after 2015. The current usage metrics is available 48-96 hours after online publication and is updated daily on week days.
Initial download of the metrics may take a while.