Fig. 12.
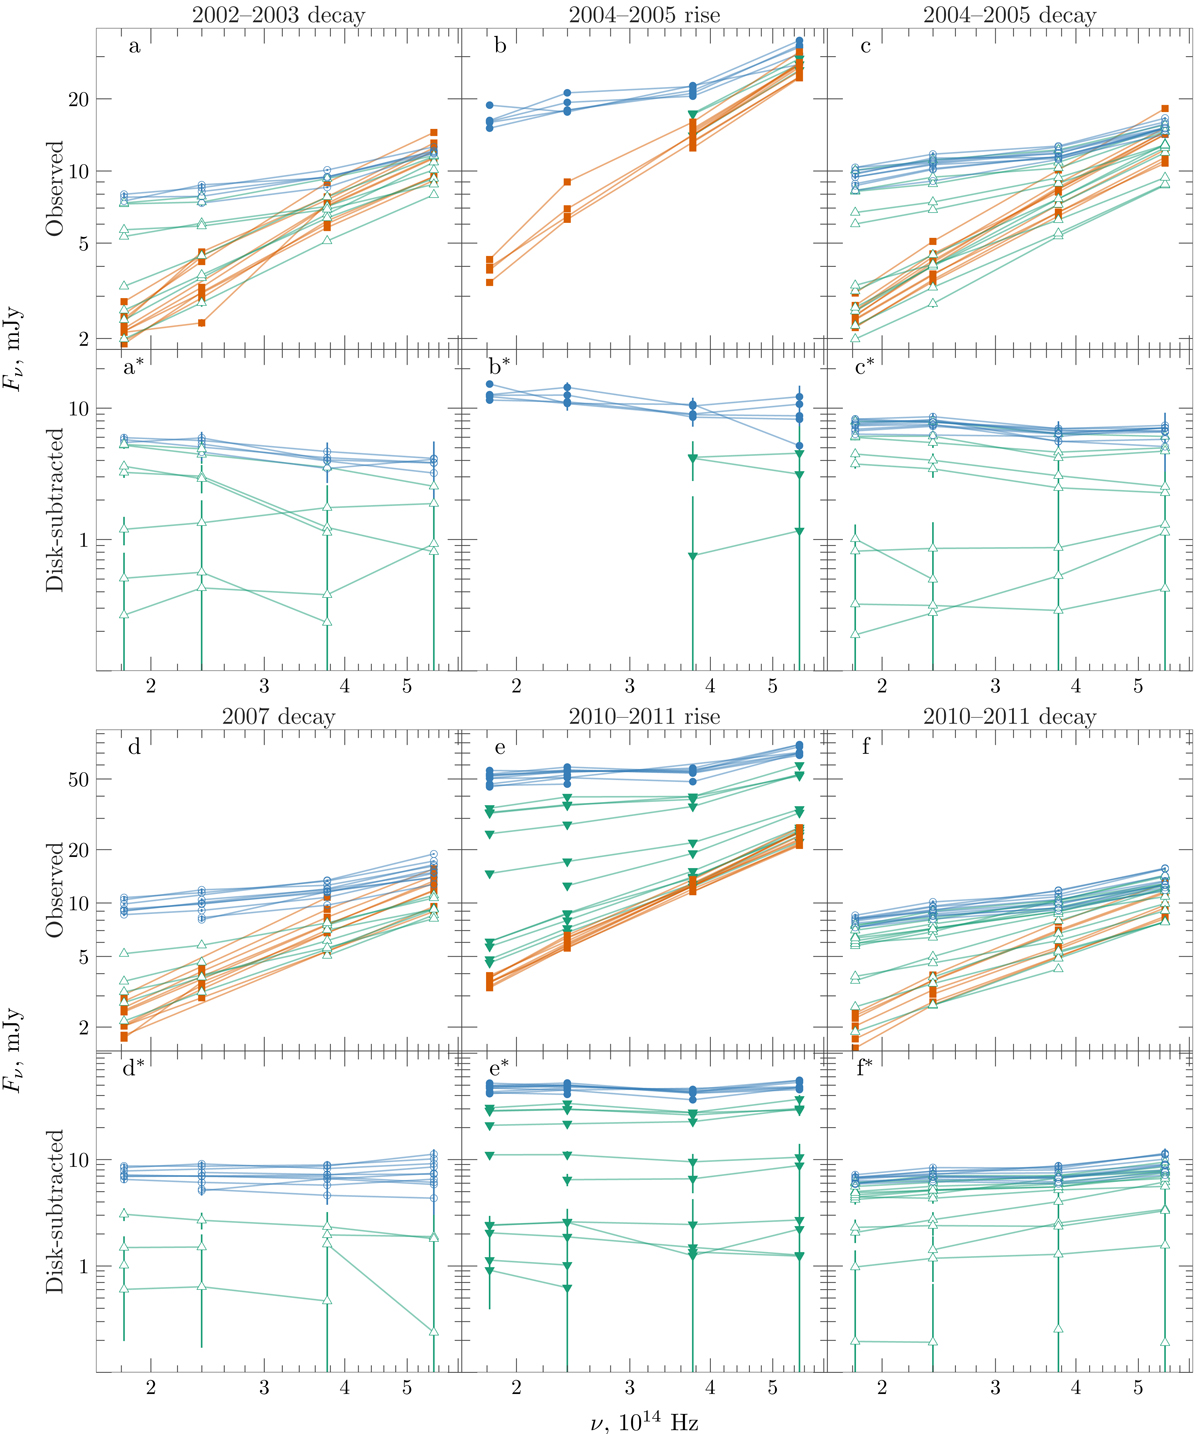
Sample of spectra from the soft state (orange squares), transition (green triangles), and the hard-state spectra (blue circles). The open symbols represent the StH state transitions, while the filled symbols indicate the HtS state transitions. Top panels (a–f): total observed spectra of the decaying part of the 2002–2003 outburst, the rising and decaying parts of the 2004–2005 outburst, the 2007 outburst, and the rising and decaying parts of the 2010–2011 outburst, respectively. Bottom panels (a*–f*): corresponding spectra after subtraction of the thermal component. Fluxes are corrected for the interstellar extinction; errors are 1σ.
Current usage metrics show cumulative count of Article Views (full-text article views including HTML views, PDF and ePub downloads, according to the available data) and Abstracts Views on Vision4Press platform.
Data correspond to usage on the plateform after 2015. The current usage metrics is available 48-96 hours after online publication and is updated daily on week days.
Initial download of the metrics may take a while.