Fig. A.3
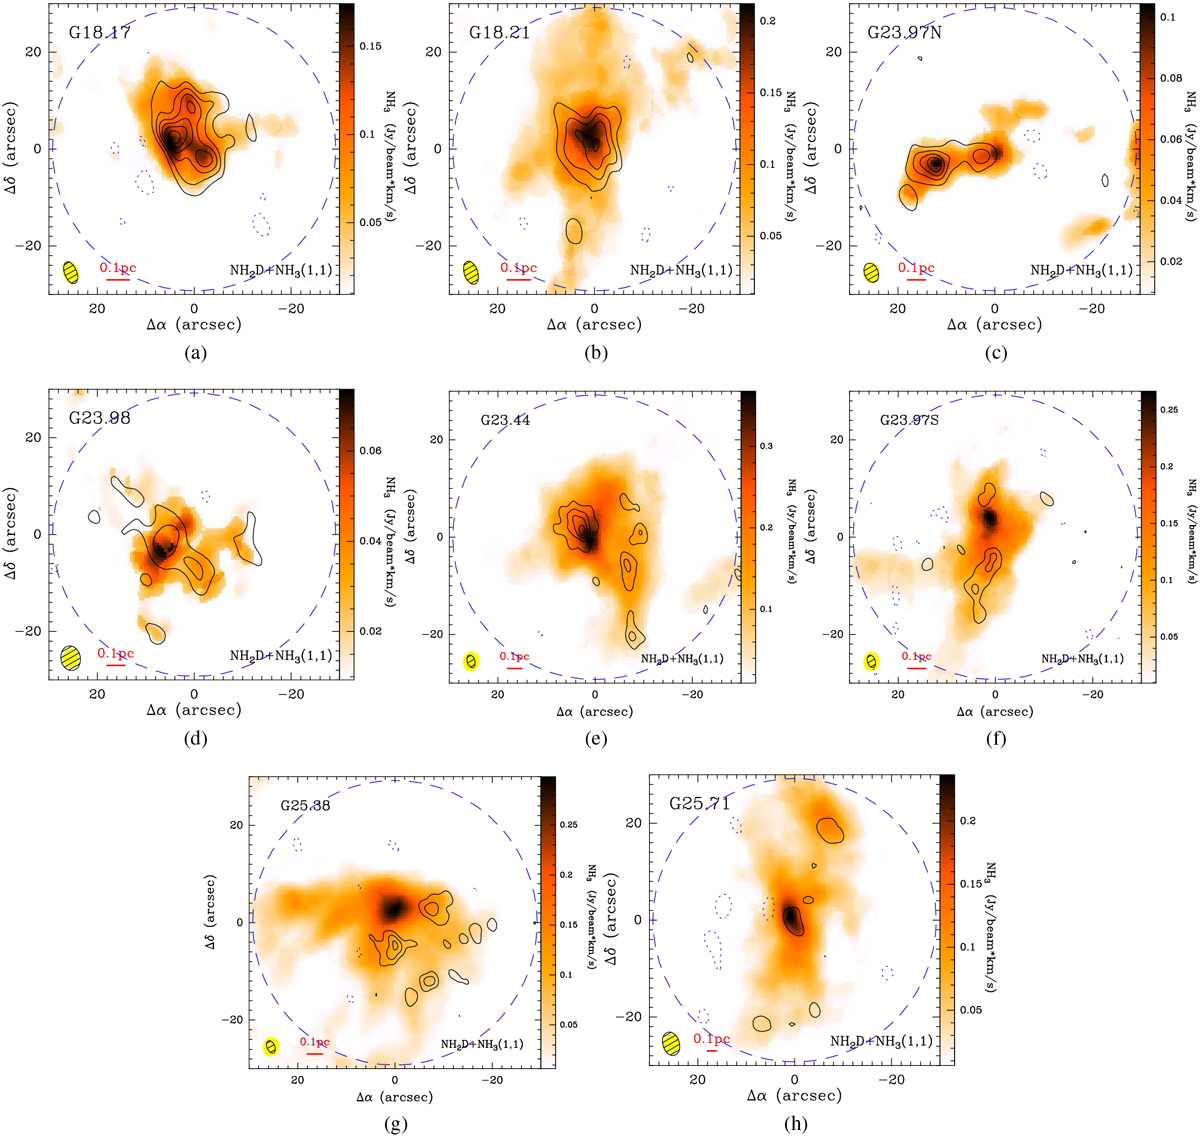
NH2D integrated-intensity contours overlaid on an NH3 (1, 1) integrated-intensity image with velocity range covering all the six HfS lines. The contour levels start at − 3σ in steps of 3σ for NH2D with σ(a)-(h) = 60.4, 60.9, 51.1, 53.2, 33.6, 23.4, 26.9, 50.4 mJy beam−1km s−1. The red numbers indicate the positions of extracted NH2D cores. The synthesized beam sizes of each subfigure are indicated at the bottom-left corner. The dashed circle indicates the primary beam of the PdBI observations at 3.5 mm.
Current usage metrics show cumulative count of Article Views (full-text article views including HTML views, PDF and ePub downloads, according to the available data) and Abstracts Views on Vision4Press platform.
Data correspond to usage on the plateform after 2015. The current usage metrics is available 48-96 hours after online publication and is updated daily on week days.
Initial download of the metrics may take a while.