Fig. 9.
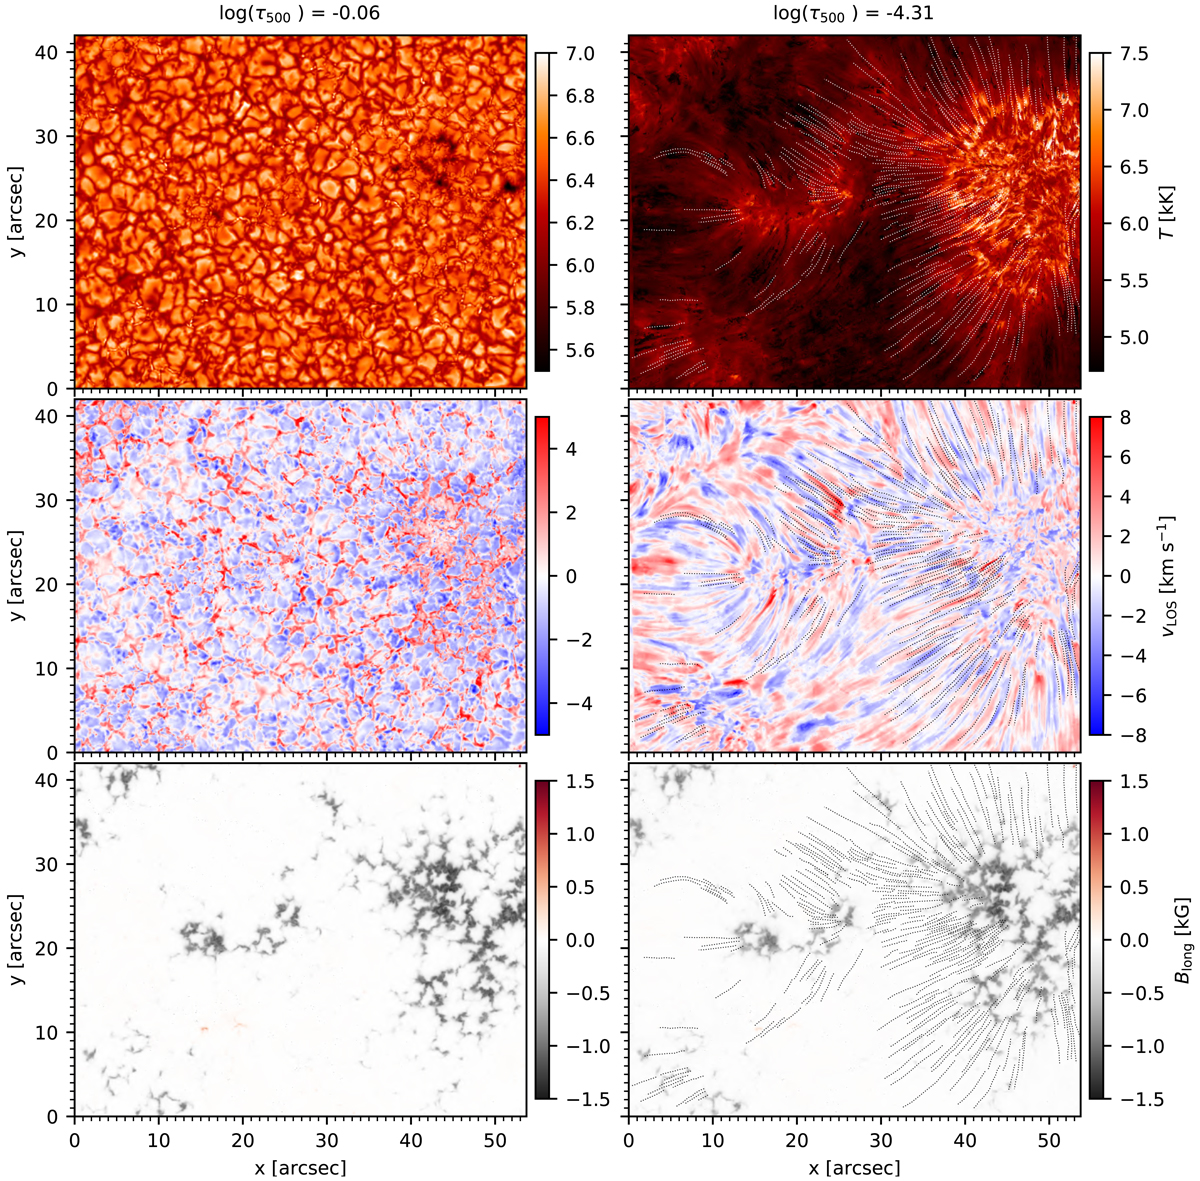
Inversion results of the FoV at log(τ500 nm) = −0.06 (left) and at log(τ500 nm) = −4.3 (right); top panels: temperature; middle and bottom panels: line-of-sight velocity and longitudinal component of the magnetic field, respectively. The paths of the Ca II K bright fibrils of our sample are overplotted with dotted curves in the chromospheric panels on the right side of the figure.
Current usage metrics show cumulative count of Article Views (full-text article views including HTML views, PDF and ePub downloads, according to the available data) and Abstracts Views on Vision4Press platform.
Data correspond to usage on the plateform after 2015. The current usage metrics is available 48-96 hours after online publication and is updated daily on week days.
Initial download of the metrics may take a while.