Fig. 8.
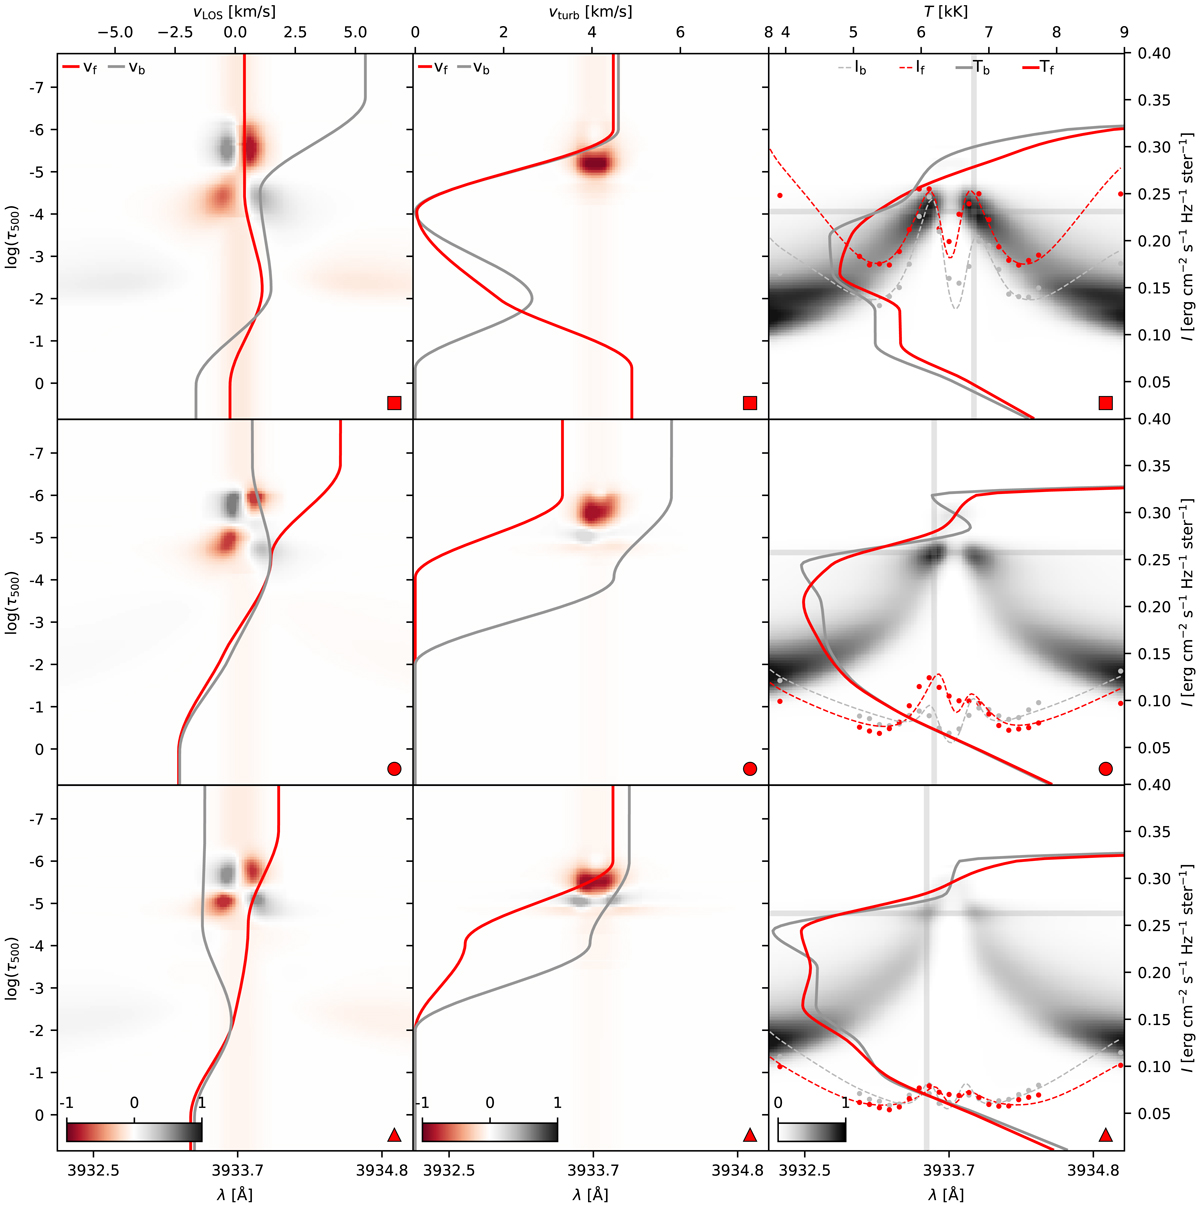
Normalised response function of the Ca II K line to the perturbations in vLOS (left), vturb (middle) and T (right) for the three points along the fibril shown in Fig. 11; the head (top row), midway (middle row) and tail (bottom row) point of the fibril are marked with a circl, square and triangle as in Figs. 4 and 11. The inferred atmospheric quantities are shown with a red solid curve for the fibril, and a grey solid curve for the background lane. The observed intensities are shown with red and grey filled circles in the right column, and the fitted line profiles are shown with dashed curves. The vertical and horizontal grey narrow bands mark the wavelength point and the continuum optical depth at which the temperature response function close to the line core has a maximum.
Current usage metrics show cumulative count of Article Views (full-text article views including HTML views, PDF and ePub downloads, according to the available data) and Abstracts Views on Vision4Press platform.
Data correspond to usage on the plateform after 2015. The current usage metrics is available 48-96 hours after online publication and is updated daily on week days.
Initial download of the metrics may take a while.