Fig. 7.
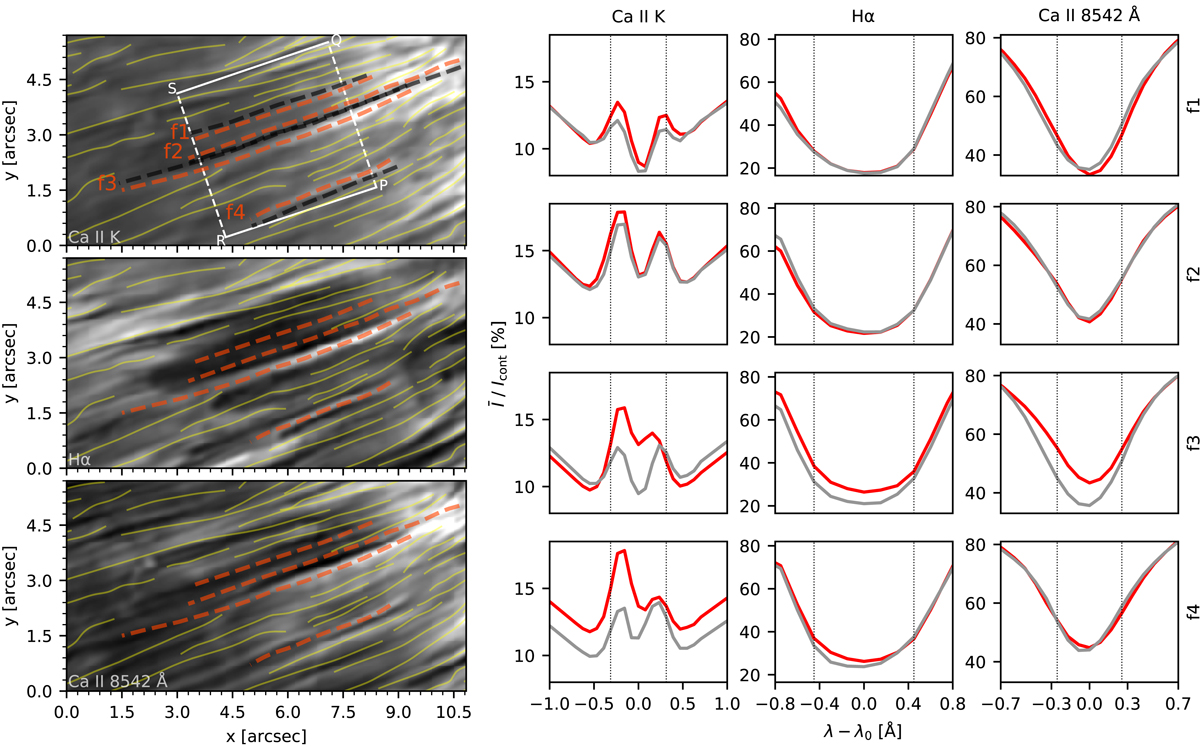
Examples of each of the four categories of fibrils; left panels: λ-summed Ca II K, Hα and Ca II 8542 Å intensity in the RoI marked with a solid-lined box in Fig. 1. The example fibrils are overplotted with red-dashed lines. Their category label and nearby background lanes (grey dashed) are marked on the Ca II K panel. The rest of the fibrils in our sample present in this region are indicated by yellow lines. The PQ and RS cuts are shown in Fig. 14 and the PQSR box is visualised in Fig. 15. The spectral profiles on the right panels show the Ca II K, Hα and Ca II 8542 Å intensity averaged over the length of the fibril (red) and the average line profile of the corresponding dark lane (grey). The dotted vertical lines mark the wavelength integration range used to produce the λ-summed intensities.
Current usage metrics show cumulative count of Article Views (full-text article views including HTML views, PDF and ePub downloads, according to the available data) and Abstracts Views on Vision4Press platform.
Data correspond to usage on the plateform after 2015. The current usage metrics is available 48-96 hours after online publication and is updated daily on week days.
Initial download of the metrics may take a while.