Free Access
Fig. 6.
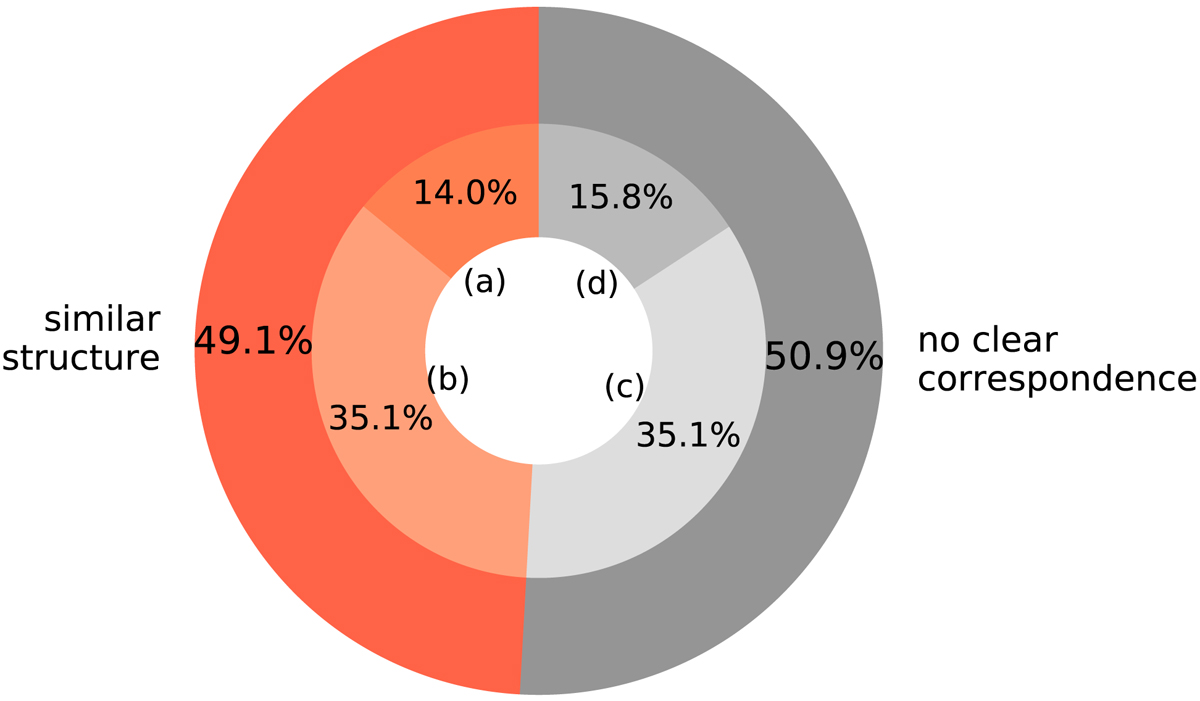
Categories in our fibril sample introduced in Sect. 3.1.3, presented as a nested pie plot; the inner circle shows the four categories and the outer circle groups the categories into those that have similar appearance in Ca II K compared to Ca II 8542 Å and Hα, and those that do not appear the same.
Current usage metrics show cumulative count of Article Views (full-text article views including HTML views, PDF and ePub downloads, according to the available data) and Abstracts Views on Vision4Press platform.
Data correspond to usage on the plateform after 2015. The current usage metrics is available 48-96 hours after online publication and is updated daily on week days.
Initial download of the metrics may take a while.