Fig. 5.
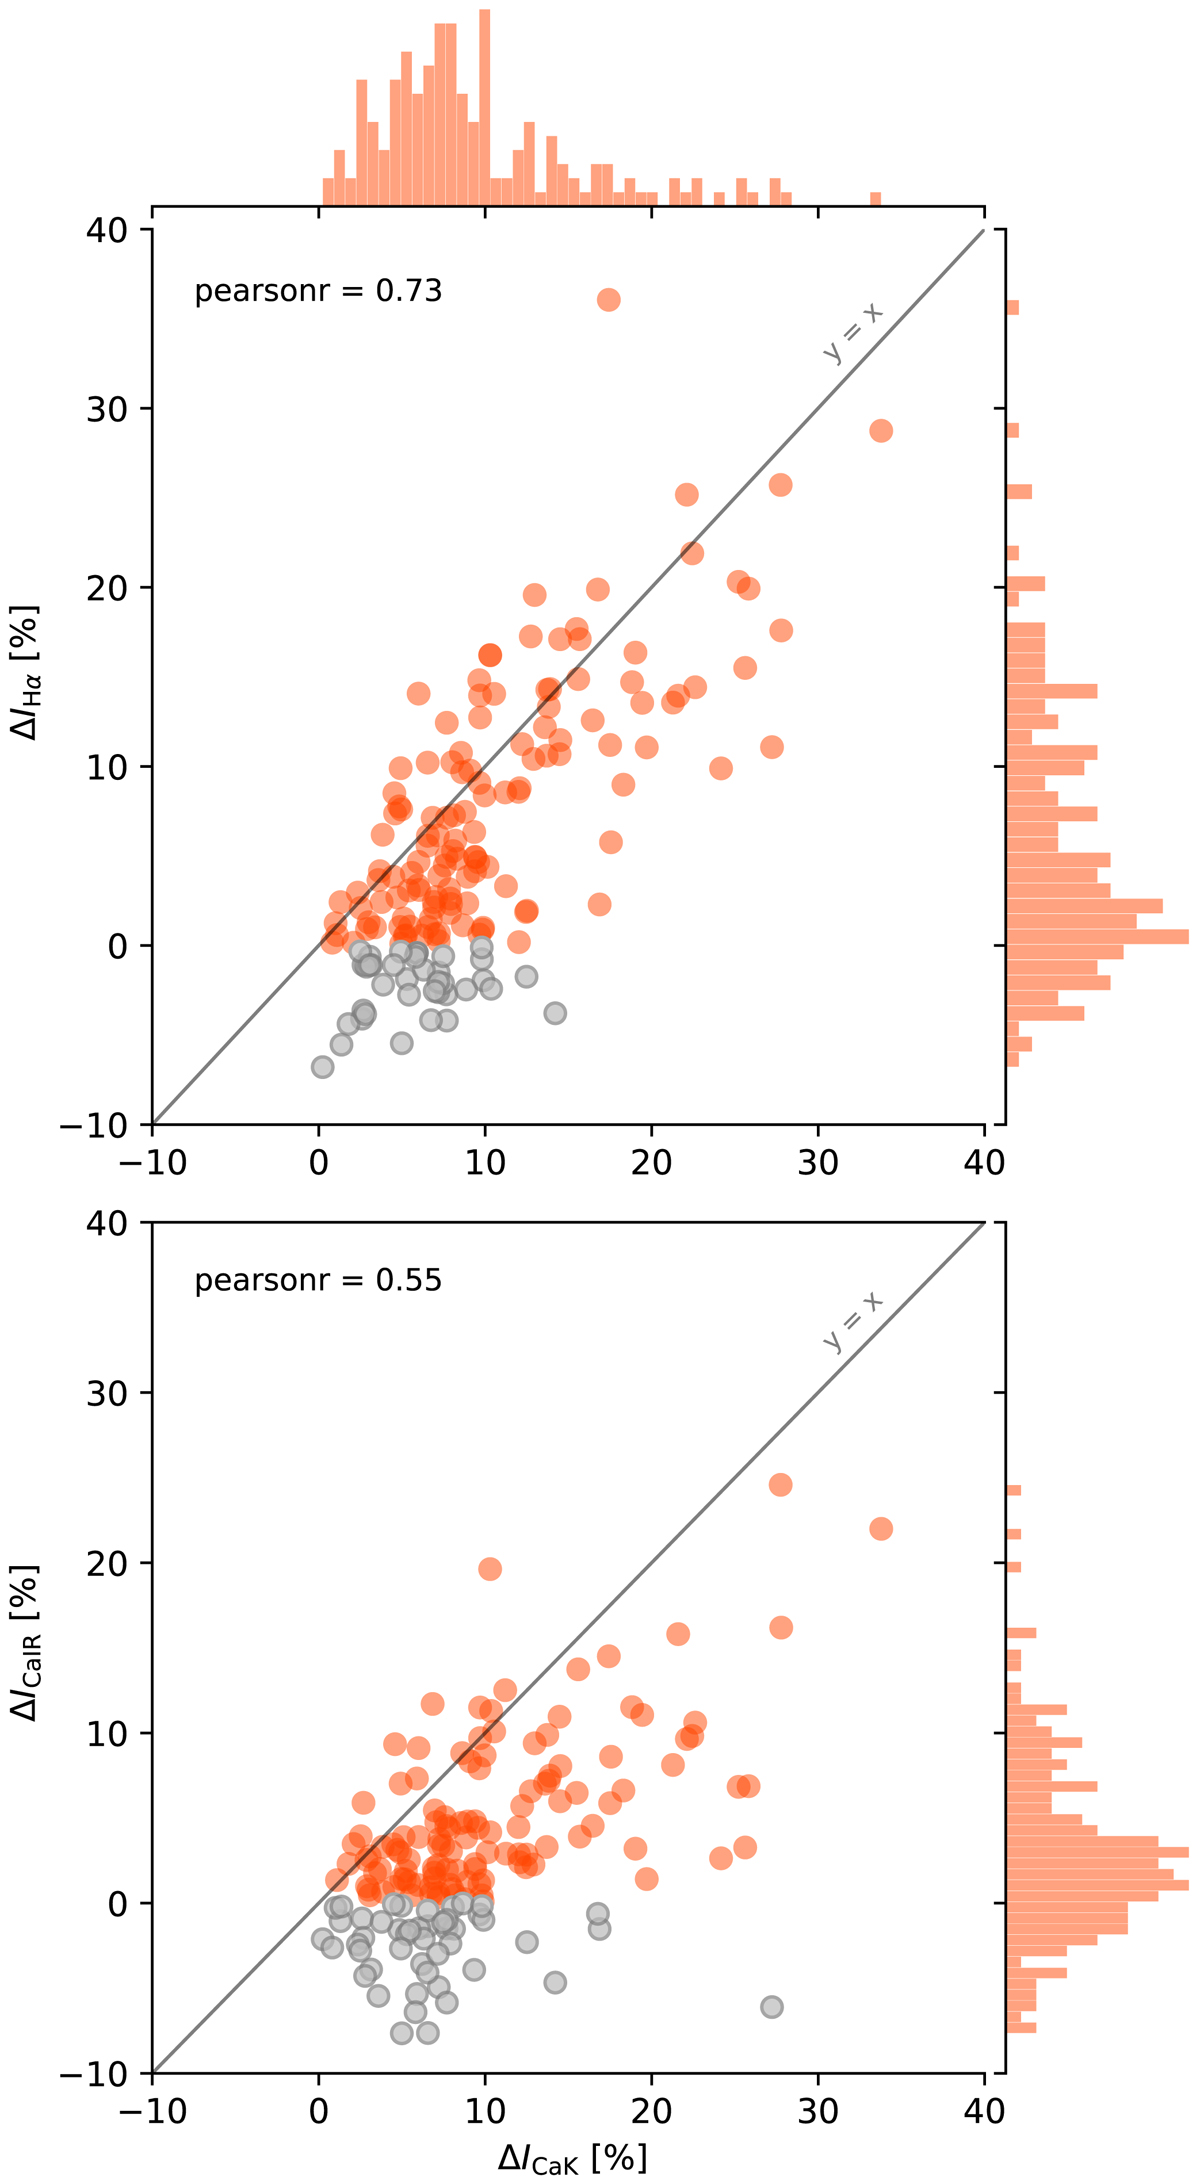
Comparison of the average intensity contrast of bright fibrils in Ca II K versus Hα (top) and Ca II 8542 Å (bottom); the orange-red filled circles show the fibrils which are bright in both Ca II K and the other line. The grey circles show the ones that are only bright in Ca II K. The distribution of the average intensity difference of the fibrils and their backgrounds are shown in the side-histograms. The Pearson correlation coefficient r is annotated on each panel. The dashed lines show the line y = x.
Current usage metrics show cumulative count of Article Views (full-text article views including HTML views, PDF and ePub downloads, according to the available data) and Abstracts Views on Vision4Press platform.
Data correspond to usage on the plateform after 2015. The current usage metrics is available 48-96 hours after online publication and is updated daily on week days.
Initial download of the metrics may take a while.