Fig. 3.
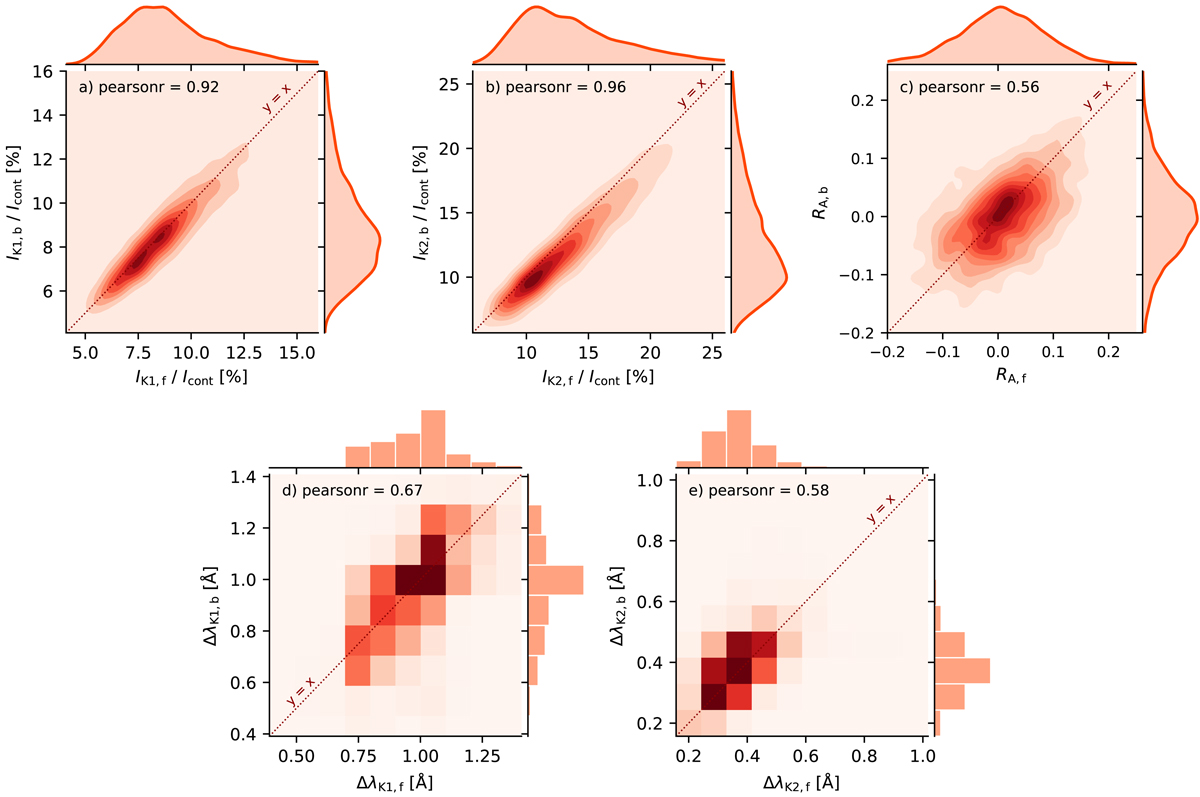
Joint probability distributions (JPDs) of Ca II K line properties of fibrillar pixels and their background counterparts that have double-peaked profiles; panels a and b: JPD of the average intensity of the K1V minima and the K2 peaks in the fibrillar pixels and their backgrounds. The average intensity value of the K1V and K2 features are normalised to the local continuum intensity. The distribution of the K2-peak asymmetry is shown on panel c. Panels d and e: K1 and K2 wavelength separations in the pixels of fibrils and their backgrounds; the bin width in these two panels is 78 mÅ that is, the spectral sampling size of CHROMIS around the Ca II K line core. The correlation between the quantities is represented by the Pearson correlation coefficient r on each panel. The y = x line is overplotted for comparison.
Current usage metrics show cumulative count of Article Views (full-text article views including HTML views, PDF and ePub downloads, according to the available data) and Abstracts Views on Vision4Press platform.
Data correspond to usage on the plateform after 2015. The current usage metrics is available 48-96 hours after online publication and is updated daily on week days.
Initial download of the metrics may take a while.