Fig. 2.
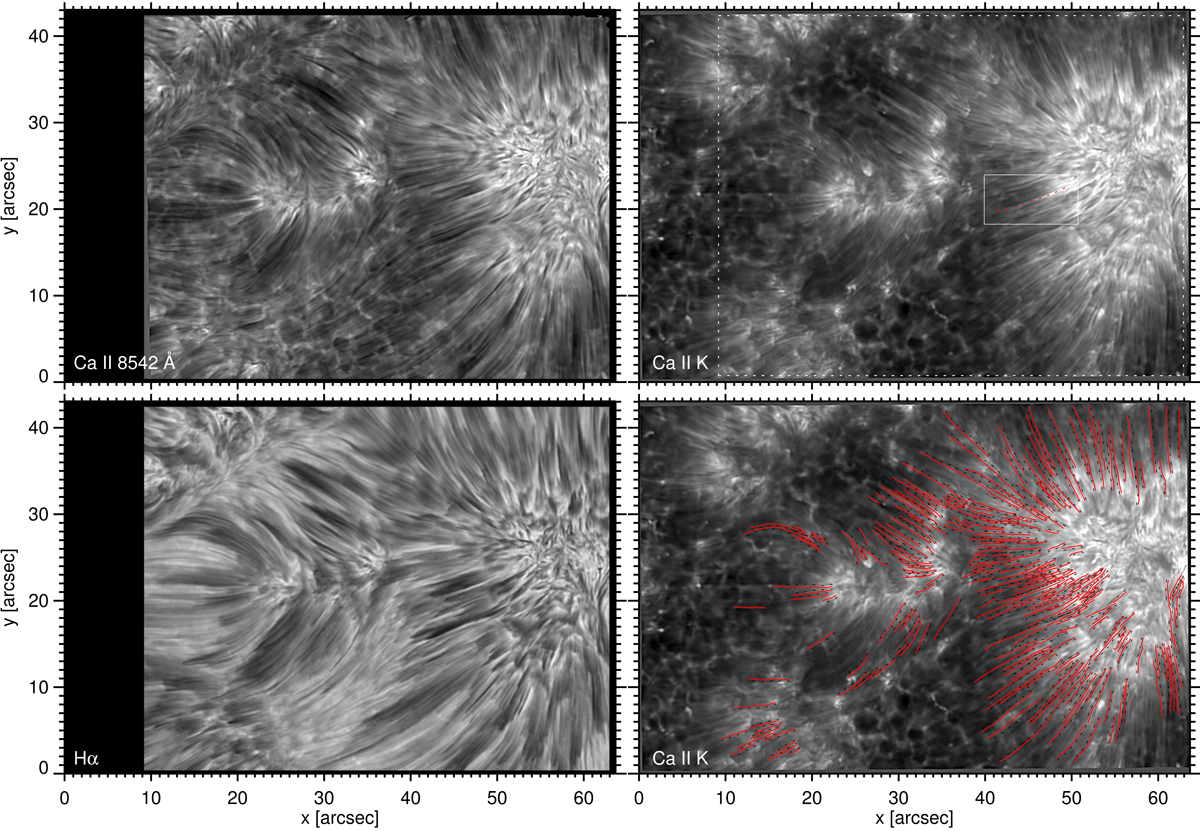
Wavelength-summed unsharp-masked maps of Ca II 8542 Å, Ca II K and Hα intensities; the dotted box in the top-right panel marks the FoV of CRISP shown in Fig. 9. The solid box shows the RoI shown in Figs. 7, 11, and 12 and the fibril indicated in it with red dotted curve is discussed in Figs. 4, 8, and 11. The paths of all the selected fibrils in our sample are overplotted with red curves and their nearby dark lanes are shown with black dotted curves in the bottom-right panel.
Current usage metrics show cumulative count of Article Views (full-text article views including HTML views, PDF and ePub downloads, according to the available data) and Abstracts Views on Vision4Press platform.
Data correspond to usage on the plateform after 2015. The current usage metrics is available 48-96 hours after online publication and is updated daily on week days.
Initial download of the metrics may take a while.