Free Access
Fig. 15.
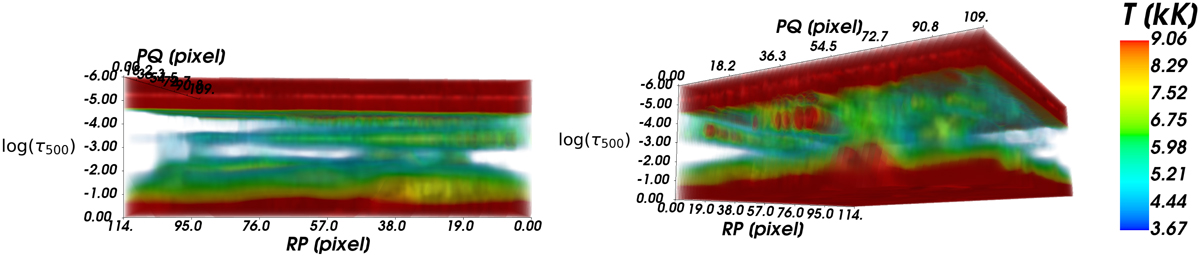
3D visualisation of the temperature variations inside the patch PQSR along the atmosphere depth (logt) shown in the RoI panels of Fig. 7, viewed from RP-side (left) and from a low angle (right). Temperatures below 3.67 kK are being transparent to make it possible to look through the cube.
Current usage metrics show cumulative count of Article Views (full-text article views including HTML views, PDF and ePub downloads, according to the available data) and Abstracts Views on Vision4Press platform.
Data correspond to usage on the plateform after 2015. The current usage metrics is available 48-96 hours after online publication and is updated daily on week days.
Initial download of the metrics may take a while.