Fig. 14.
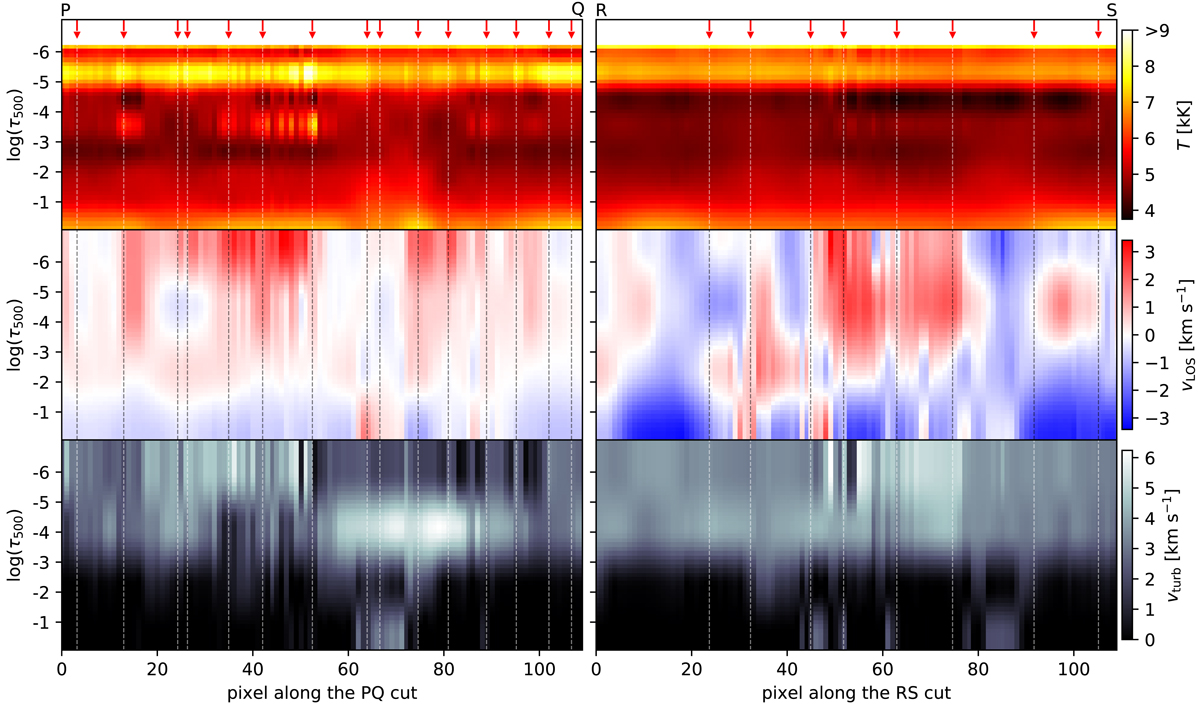
Inversion results of temperature (top), line-of-sight velocity (middle) and microtubulent velocity (bottom) in PQ (left) and RS (right) cuts in the atmosphere across the head and the tail of the fibrils, respectively. The cross point of the fibrils with the cuts are shown with the red arrows. The location of the cuts and the bright fibrils pass through them are in the RoI are marked in Figs. 7 and 12.
Current usage metrics show cumulative count of Article Views (full-text article views including HTML views, PDF and ePub downloads, according to the available data) and Abstracts Views on Vision4Press platform.
Data correspond to usage on the plateform after 2015. The current usage metrics is available 48-96 hours after online publication and is updated daily on week days.
Initial download of the metrics may take a while.