Fig. 12.
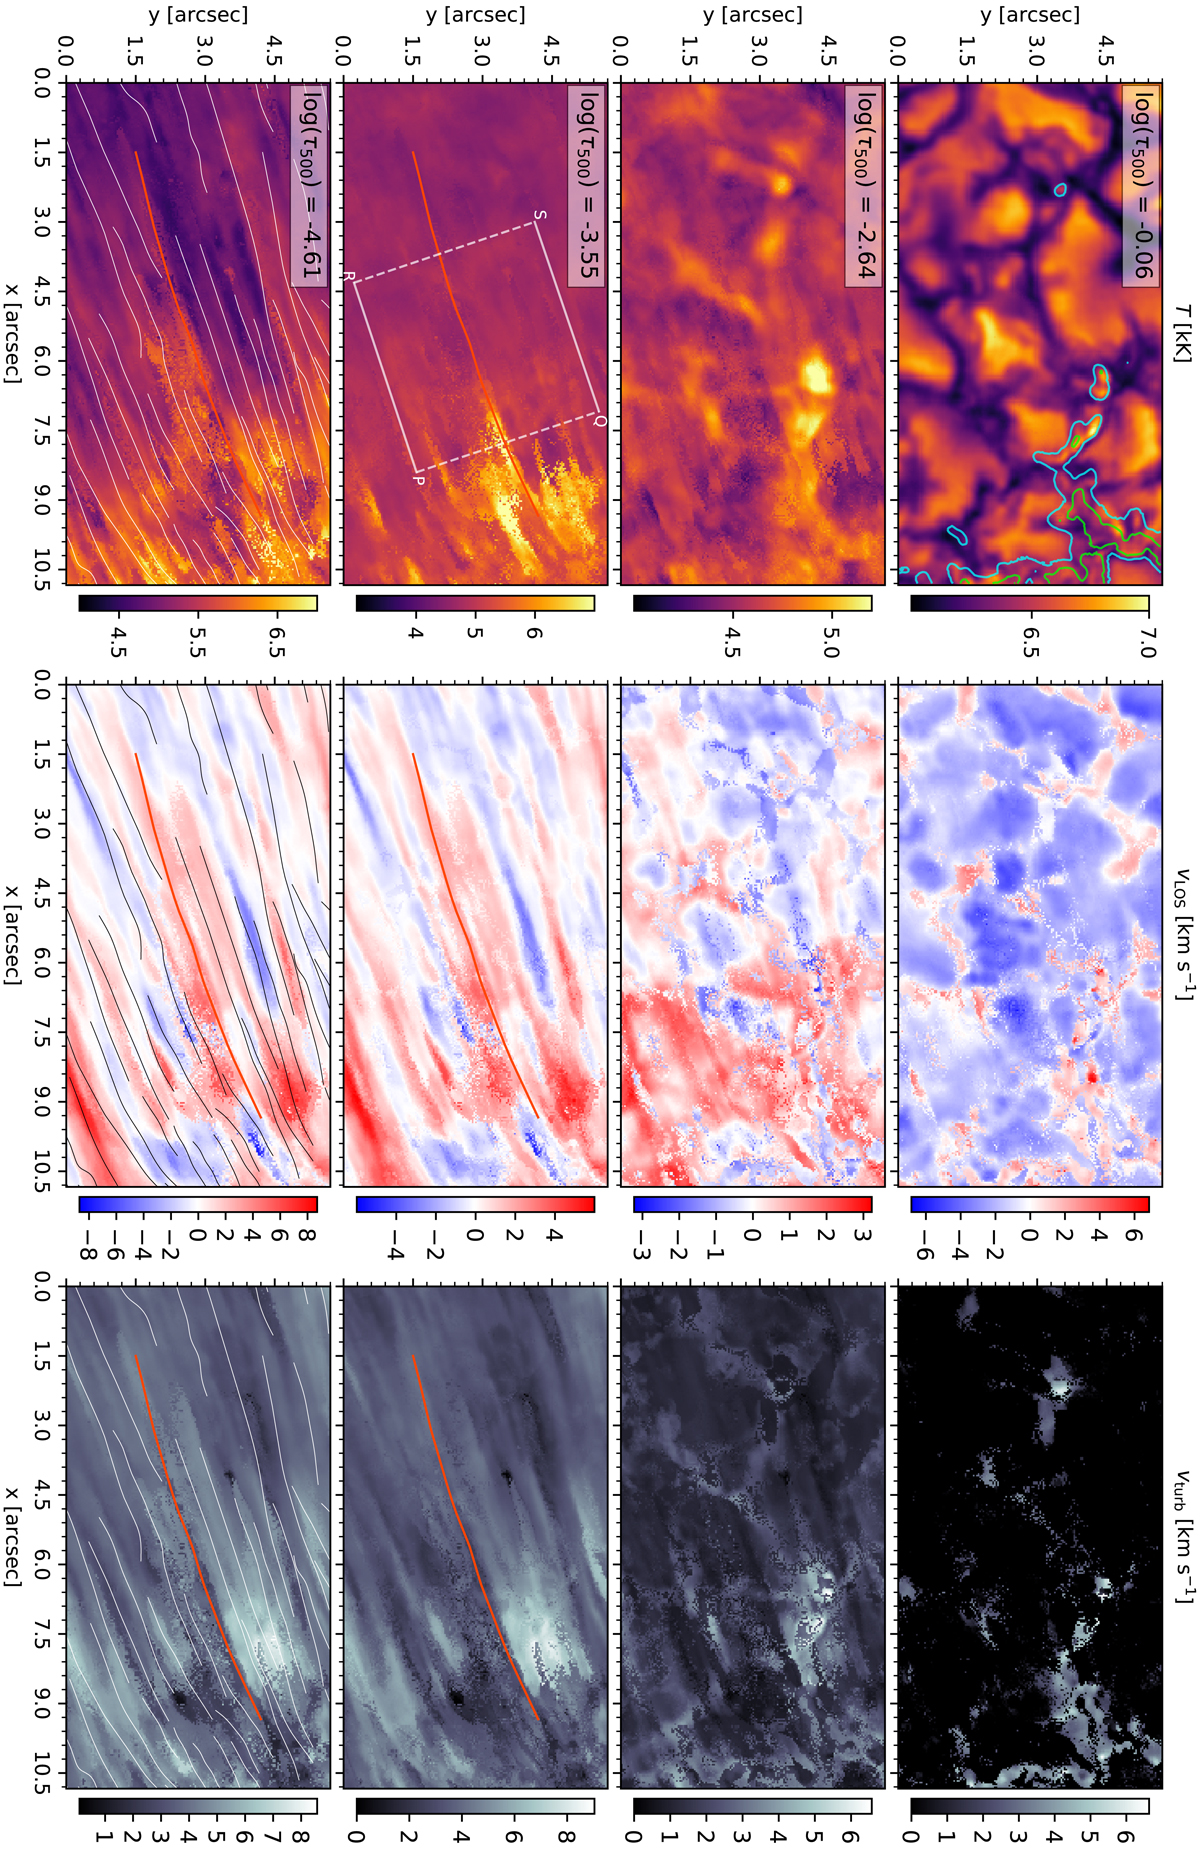
Temperature (left), line-of-sight velocity (middle) and microturbulent velocity (right) as derived from the inversions. Each row shows a different heights in the atmosphere, as marked in the temperature panels. The identified Ca II K bright fibrils are overplotted in white and the fibril studied in Sect. 3.2.4 is shown with a red path. The contours levels overplotted on the temperature panel at log(τ500 nm) = −0.06 show the strength of the longitudinal component of the photospheric magnetic field at 200 G (cyan) and 800 G (green).
Current usage metrics show cumulative count of Article Views (full-text article views including HTML views, PDF and ePub downloads, according to the available data) and Abstracts Views on Vision4Press platform.
Data correspond to usage on the plateform after 2015. The current usage metrics is available 48-96 hours after online publication and is updated daily on week days.
Initial download of the metrics may take a while.