Fig. 11.
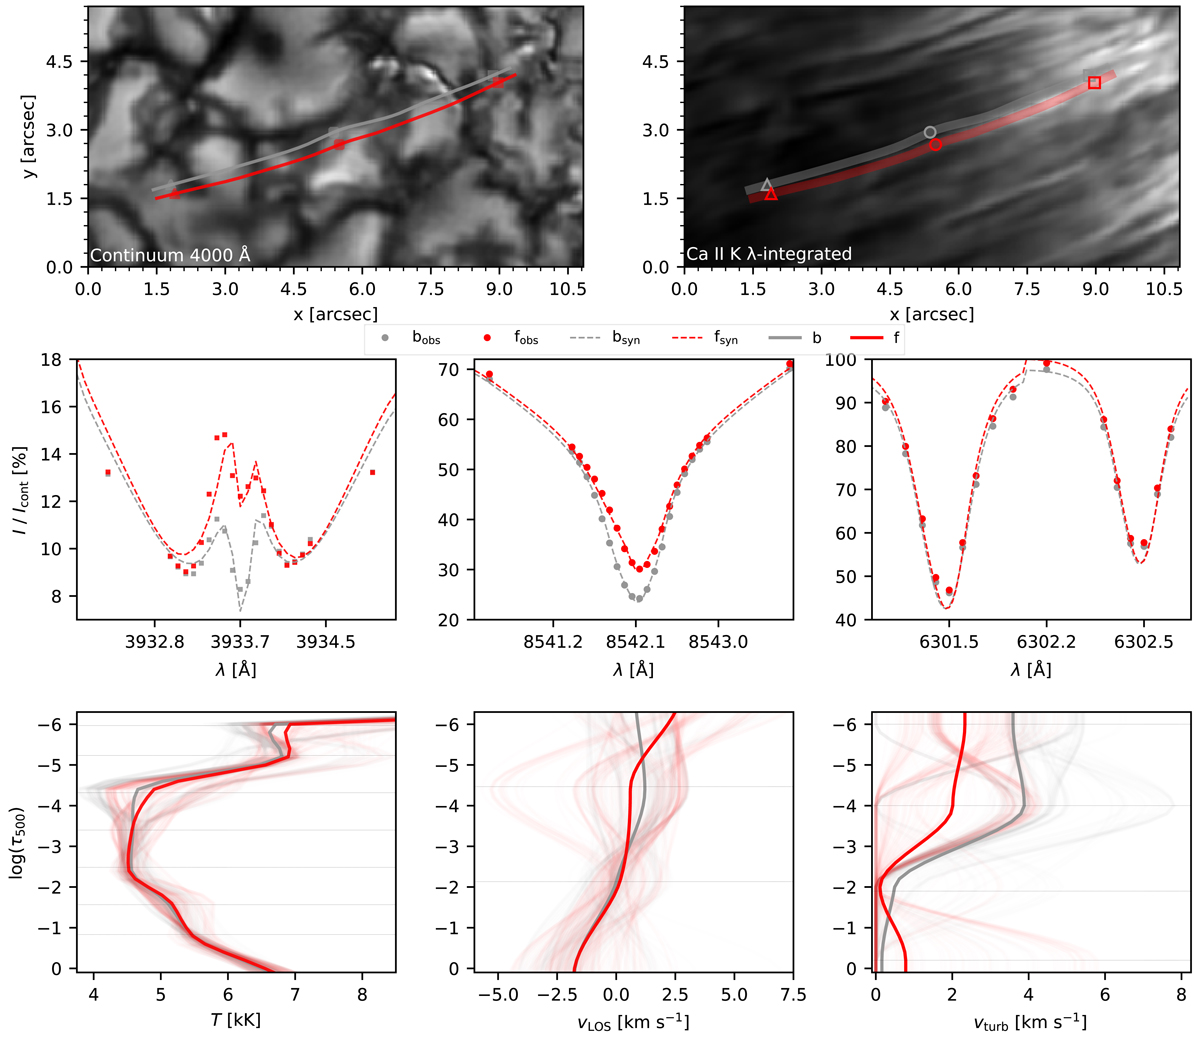
Inversion results along the fibril–background set labelled with f3 in Fig. 7; top panels: fibril (red) and background (grey) overplotted on intensity maps of the RoI marked with a solid-lined box in Fig. 1 in the continuum and Ca II K summed light. The head, midpoint and tail of the structures are marked similarly to Fig. 4. The average observed and synthesised line profiles along the structures are shown in the middle row panels. The inversion results of the temperature, line-of-sight and microturbulence velocities for each individual pixel along the path of the structures are plotted with the washed-out lines and the average profiles are shown with the bold lines in the bottom panels. An animated version of this figure showing the fit of each indiviudual line profile along the fibril is available online.
Current usage metrics show cumulative count of Article Views (full-text article views including HTML views, PDF and ePub downloads, according to the available data) and Abstracts Views on Vision4Press platform.
Data correspond to usage on the plateform after 2015. The current usage metrics is available 48-96 hours after online publication and is updated daily on week days.
Initial download of the metrics may take a while.