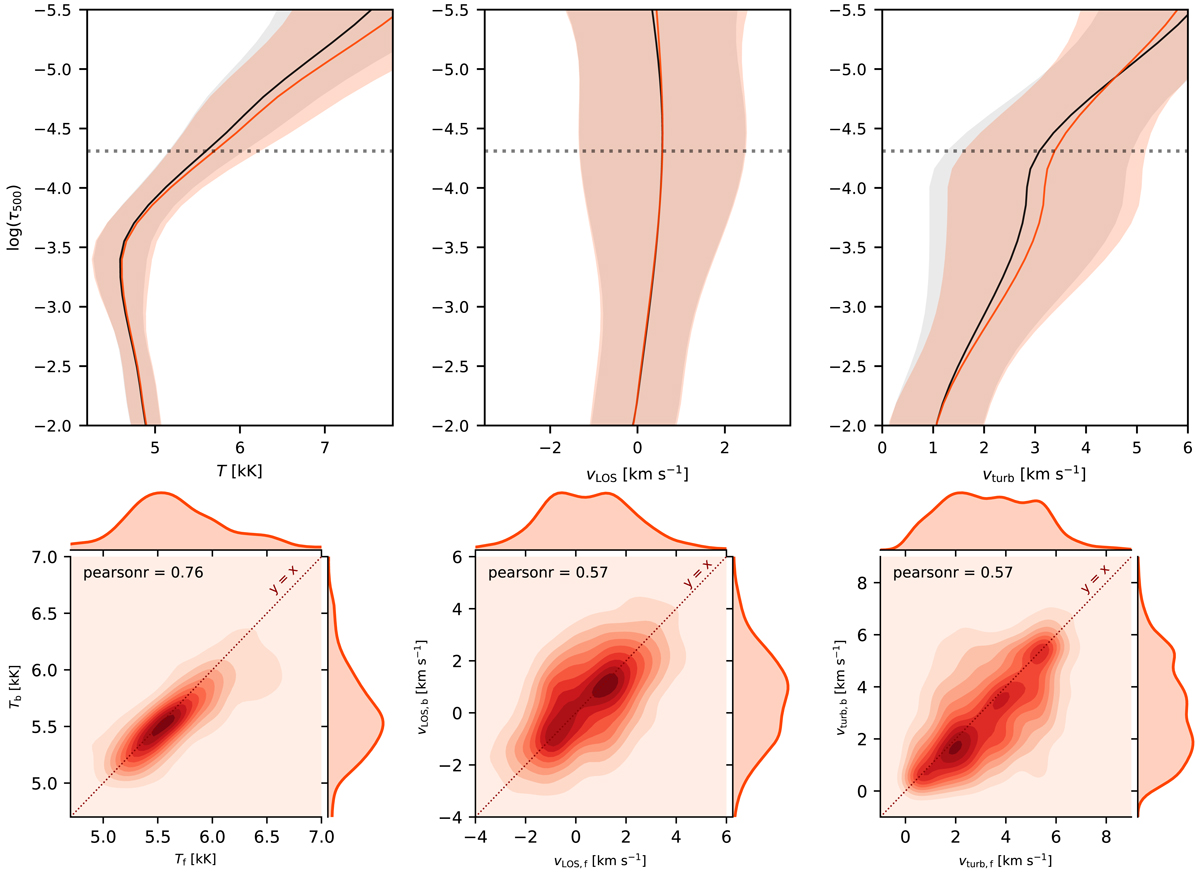
Fig. 10.

Inversion results of the physical quantities at the location of the fibrils in our sample and their background lanes; top panels: mean profile of the temperature (left), line-of-sight velocity (middle) and microturbulence (right). The fibrillar profiles are plotted with red and the background profiles are plotted with black curves. The range of [μ − σ, μ + σ] is shown with the bands with the same colour as the mean profiles in each of the panels on top, where μ is the mean value and σ is the standard deviation of the physical parameters for all the pixels along the fibrils and their backgrounds. The horizontal dotted line marks the depth log(τ500 nm) = −4.31. Bottom panels: joint probability distributions of the physical parameters in the fibrillar pixels and their background lane at log(τ500 nm) = −4.31. The Pearson correlation coefficient r and the y = x line is shown in each panel of the bottom row.
Current usage metrics show cumulative count of Article Views (full-text article views including HTML views, PDF and ePub downloads, according to the available data) and Abstracts Views on Vision4Press platform.
Data correspond to usage on the plateform after 2015. The current usage metrics is available 48-96 hours after online publication and is updated daily on week days.
Initial download of the metrics may take a while.


