Fig. 1.
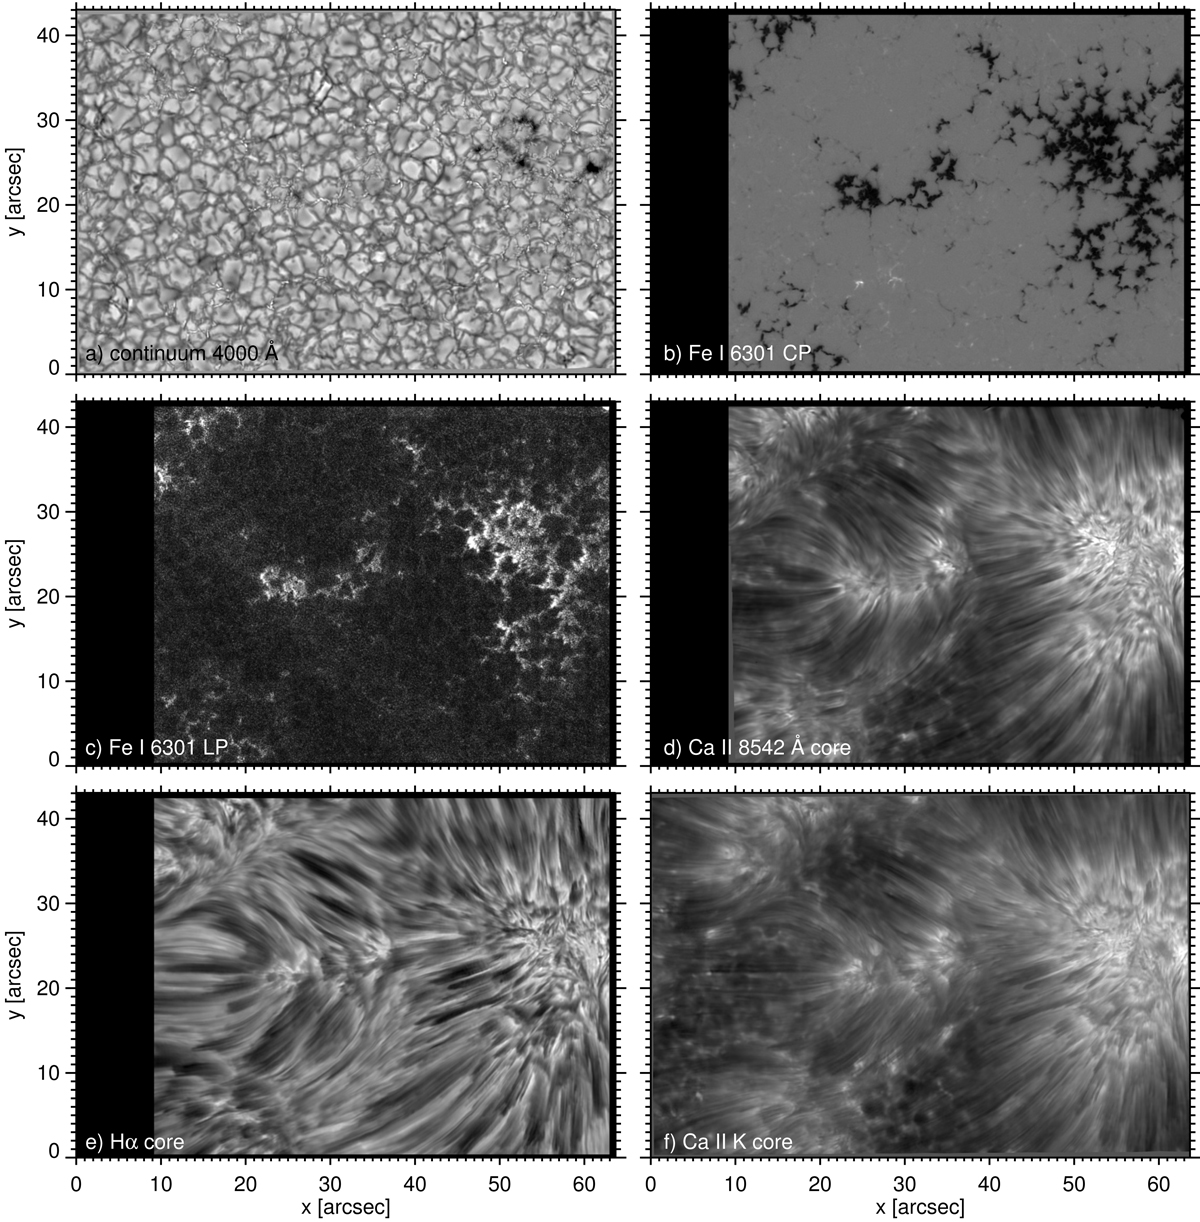
Overview of the observations taken on 2016-09-15 at 08:57:02 UT. (a) Continuum intensity at 4000 Å; (b) wavelength-averaged circular polarisation map based on the Stokes V signal in the Fe I 6301 line; (c) wavelength-averaged linear polarisation map based on the Stokes Q and U signal in the Fe I 6301 line; (d) Ca II 8542 Å nominal line centre intensity; (e) Hα nominal line centre intensity; (f) Ca II K nominal line centre intensity. Panels d and f have been gamma-corrected to increase visibility of the structures present in the images.
Current usage metrics show cumulative count of Article Views (full-text article views including HTML views, PDF and ePub downloads, according to the available data) and Abstracts Views on Vision4Press platform.
Data correspond to usage on the plateform after 2015. The current usage metrics is available 48-96 hours after online publication and is updated daily on week days.
Initial download of the metrics may take a while.