Fig. 7.
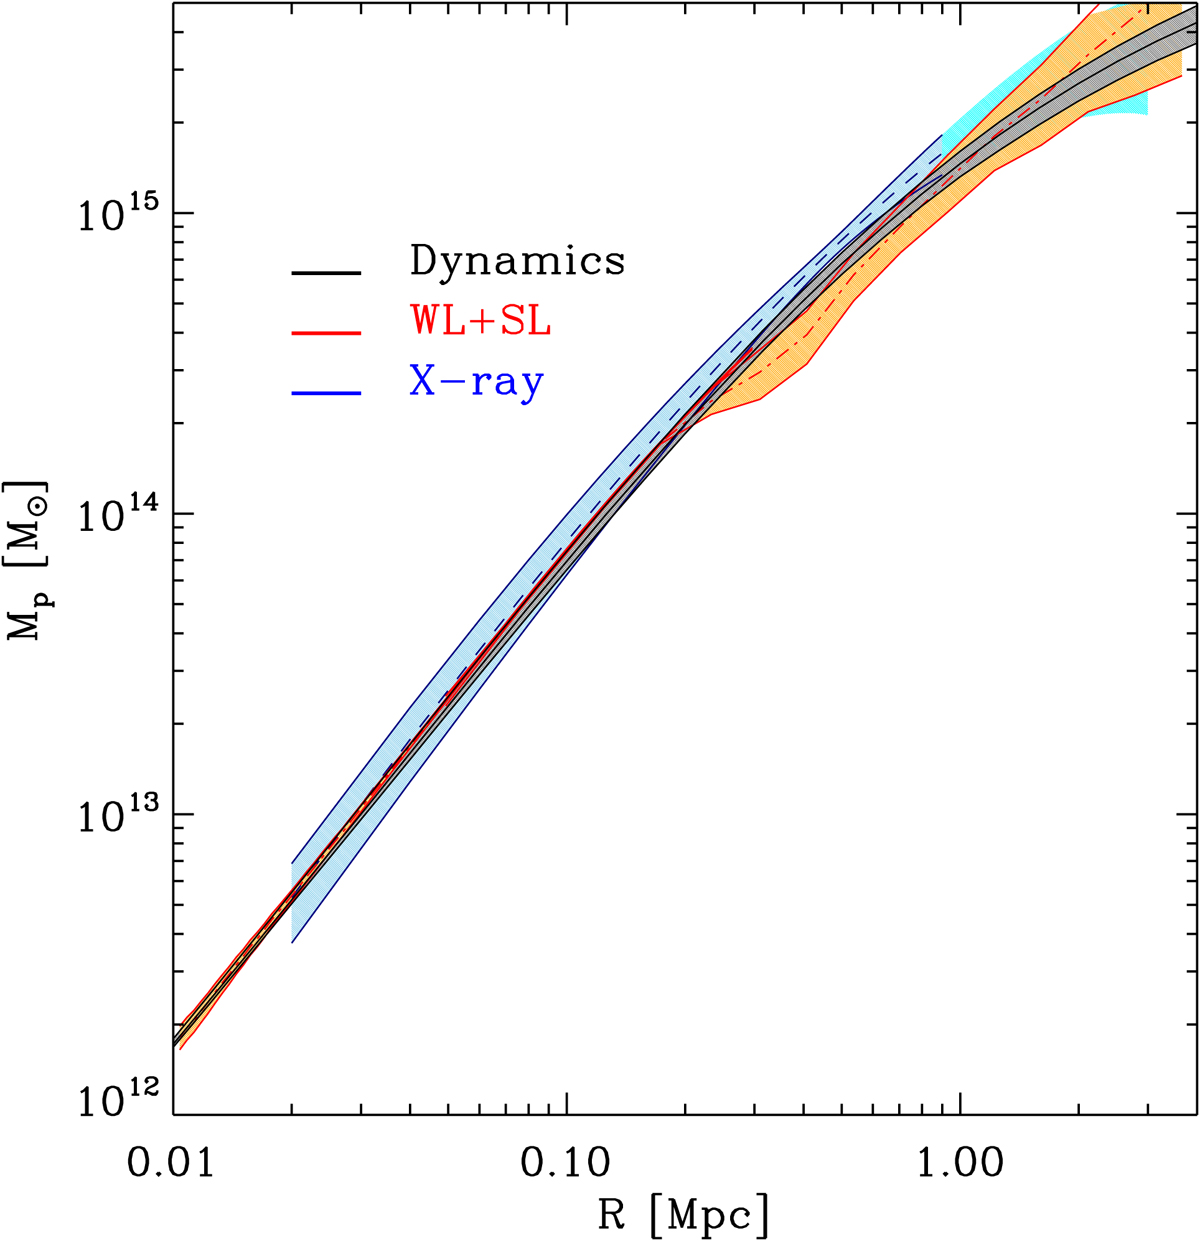
Total projected mass profile comparison. Black: projection of the 3D total mass in Fig. 5 as derived from our dynamical analysis. Red: result from the combined weak lensing analysis by Umetsu et al. (2016) and strong lensing analysis by Caminha et al. (2016). Blue: result from the X-ray data analysis using the hydrostatic equilibrium equation; in cyan we indicate the region where the X-ray profile has been extrapolated. The shaded areas show 68% confidence regions.
Current usage metrics show cumulative count of Article Views (full-text article views including HTML views, PDF and ePub downloads, according to the available data) and Abstracts Views on Vision4Press platform.
Data correspond to usage on the plateform after 2015. The current usage metrics is available 48-96 hours after online publication and is updated daily on week days.
Initial download of the metrics may take a while.