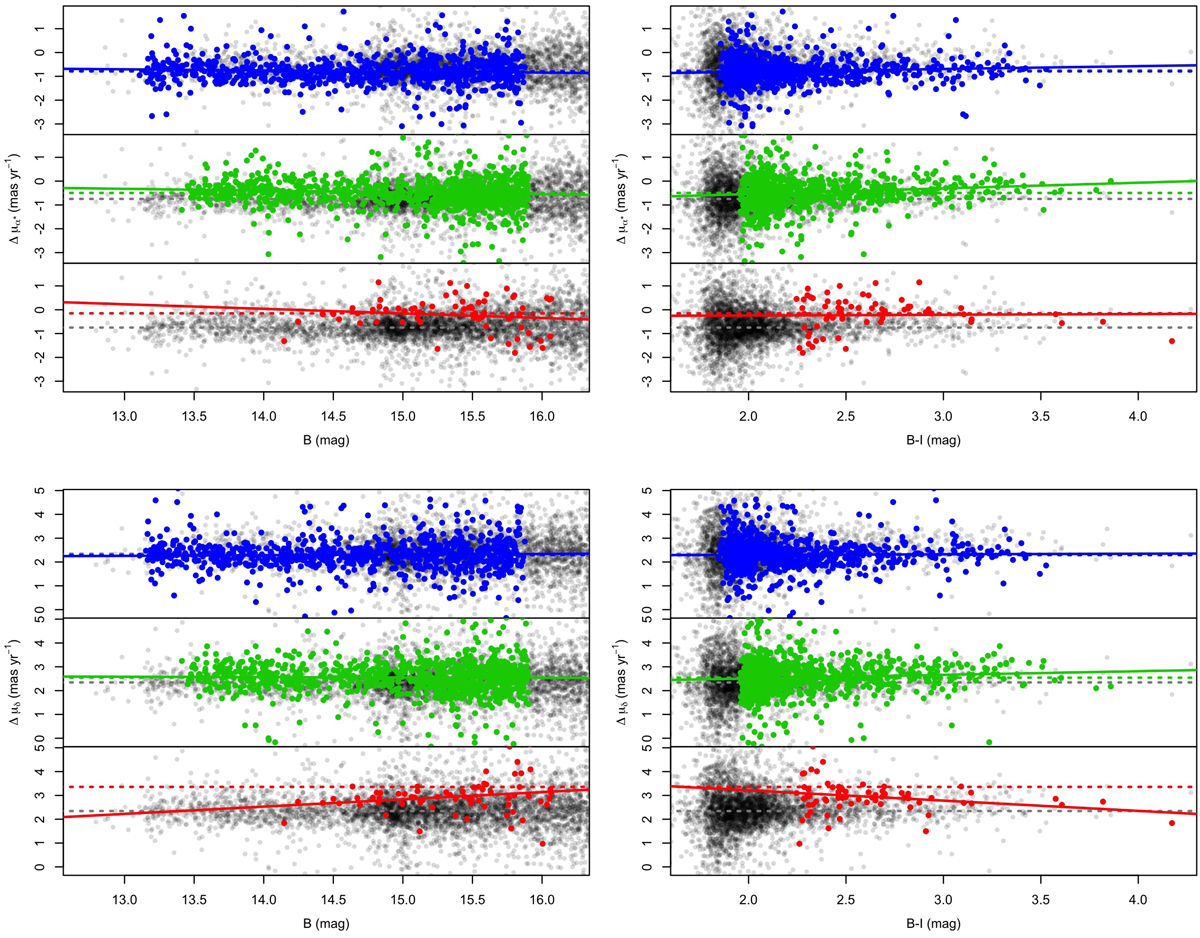
Fig. 5.

Difference of the proper motion in RA (top panels) and Dec (bottom panels) by van Leeuwen et al. (2000) and Gaia Collaboration (2018b) as a function of magnitude (left panels) and of colour (right panels). Stars are coloured as in the previous figures. The average difference between the two catalogues are plotted as grey dotted lines, the ones for each sub-population are plotted as dotted lines of the respective colours, and the linear fits for each sub-population are shown as solid lines of the respective colours. None of the slopes are statistically significant, even the few that appear large are driven by single data points and a small sample size (see Sect. 2 and Table 2).
Current usage metrics show cumulative count of Article Views (full-text article views including HTML views, PDF and ePub downloads, according to the available data) and Abstracts Views on Vision4Press platform.
Data correspond to usage on the plateform after 2015. The current usage metrics is available 48-96 hours after online publication and is updated daily on week days.
Initial download of the metrics may take a while.


