Fig. 3.
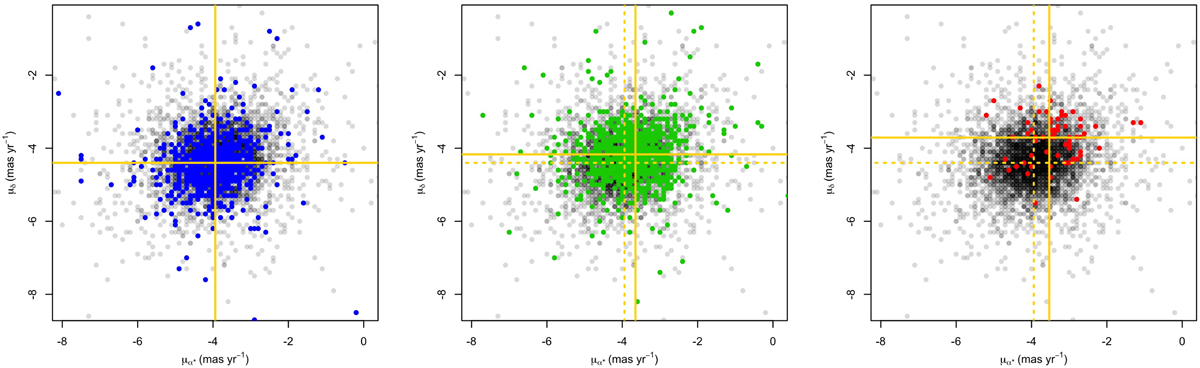
Proper motion vector diagram of the selected members of ω Centauri (grey dots in all panels) using the astrometry by van Leeuwen et al. (2000). Each panel represents one RGB sub-population with the same colours as in Fig. 2. The solid yellow lines are the mean motion of each sub-population according to Ferraro et al. (2002), while the RGB-MP mean motion is reported as a dotted yellow line in the middle and right panels. The RGB-Mint and RGB-a populations are clearly offset from the RGB-MP one, as was found by Ferraro et al. (2002).
Current usage metrics show cumulative count of Article Views (full-text article views including HTML views, PDF and ePub downloads, according to the available data) and Abstracts Views on Vision4Press platform.
Data correspond to usage on the plateform after 2015. The current usage metrics is available 48-96 hours after online publication and is updated daily on week days.
Initial download of the metrics may take a while.