Fig. 2.
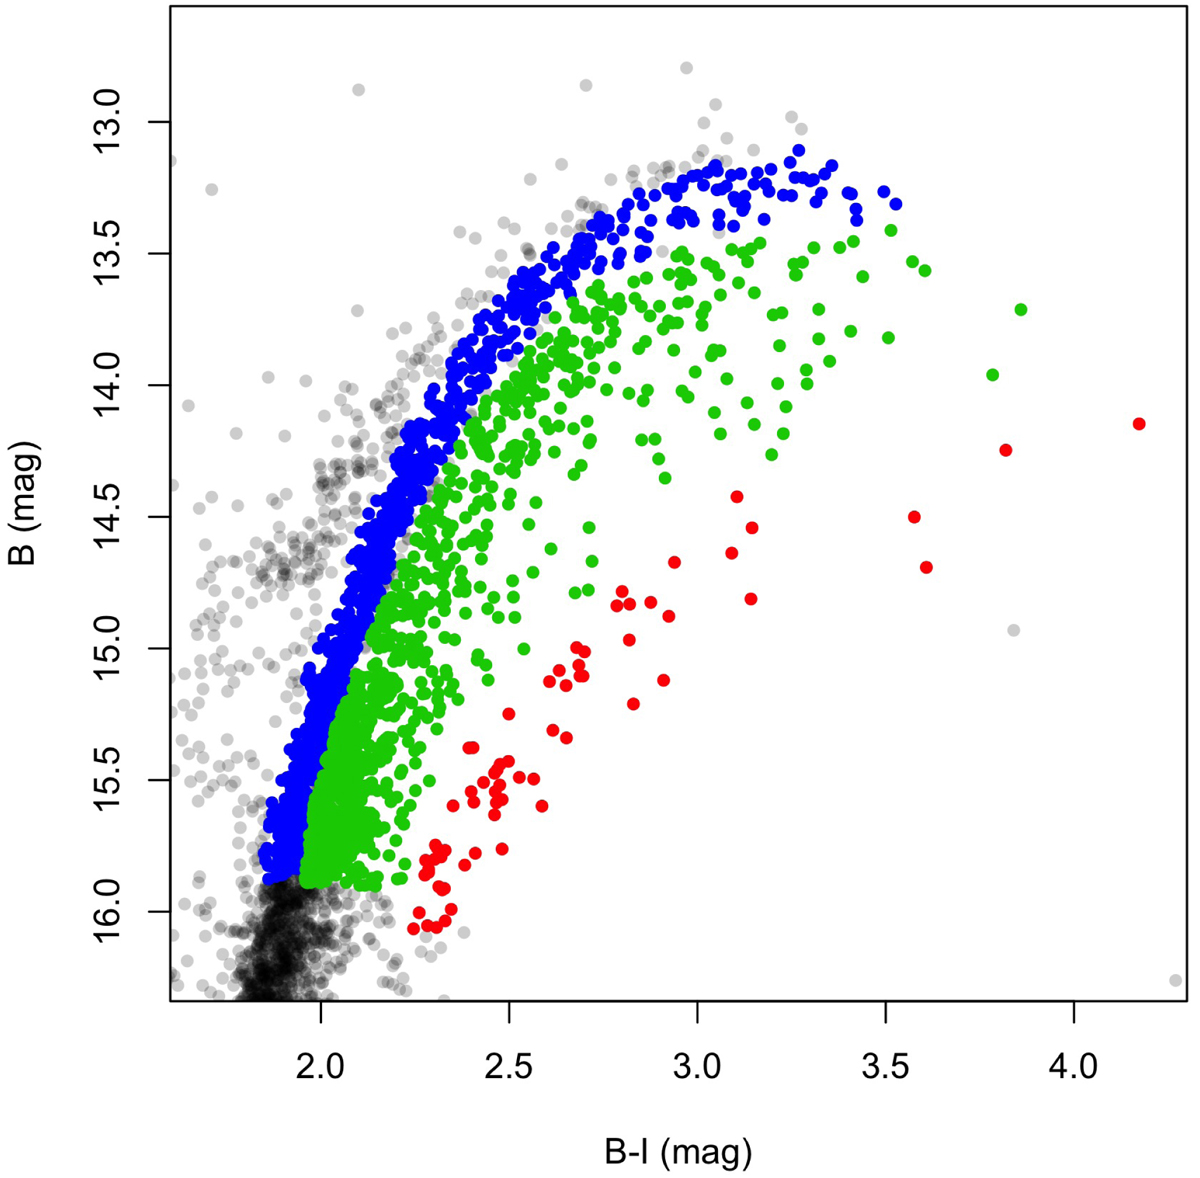
Selection of the three sub-populations following criteria as similar as possible to those by Ferraro et al. (2002). The grey dots in the background represent the selected members of ω Centauri; blue dots represent the RGB-MP sample, following the nomenclature by Pancino et al. (2000) and Ferraro et al. (2002); green dots: the RGB-Mint sample; and red dots: the RGB-a sample.
Current usage metrics show cumulative count of Article Views (full-text article views including HTML views, PDF and ePub downloads, according to the available data) and Abstracts Views on Vision4Press platform.
Data correspond to usage on the plateform after 2015. The current usage metrics is available 48-96 hours after online publication and is updated daily on week days.
Initial download of the metrics may take a while.