Fig. 8
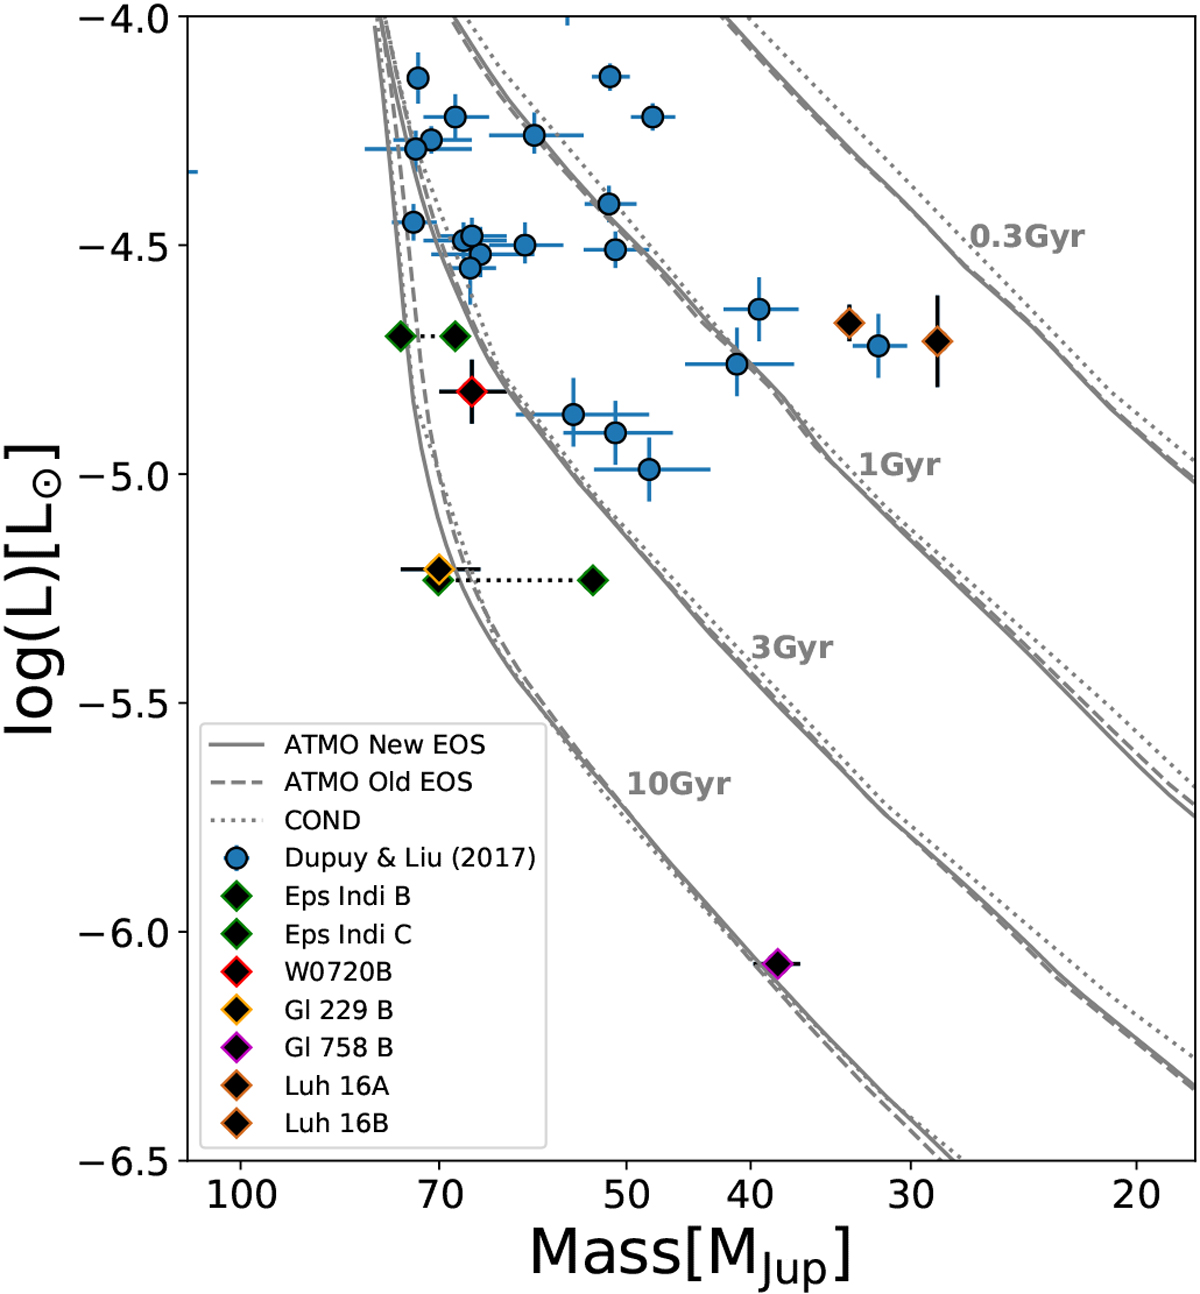
Luminosity as a function of mass for ultracool dwarfs that have dynamical mass measurements. ATMO isochrones from this work calculated using the new EOS from Chabrier et al. (2019) and the older EOS of Saumon et al. (1995) are plotted as solid and dashed grey lines respectively. Isochrones from the AMES-Cond models of B03 are plotted as dotted grey lines. Most mass measurements are from Dupuy & Liu (2017) and are plotted as blue circles, with other literature measurements plotted as black diamonds (Bowler et al. 2018; Lazorenko & Sahlmann 2018; Dupuy et al. 2019; Brandt et al. 2019). Both mass measurements of ɛ Indi BC from Cardoso (2012) and Dieterich et al. (2018) are plotted, and we refer the reader to Dupuy et al. (2019) for a discussion on these conflicting mass measurements. We indicate key objects with coloured outlines.
Current usage metrics show cumulative count of Article Views (full-text article views including HTML views, PDF and ePub downloads, according to the available data) and Abstracts Views on Vision4Press platform.
Data correspond to usage on the plateform after 2015. The current usage metrics is available 48-96 hours after online publication and is updated daily on week days.
Initial download of the metrics may take a while.