Fig. 18
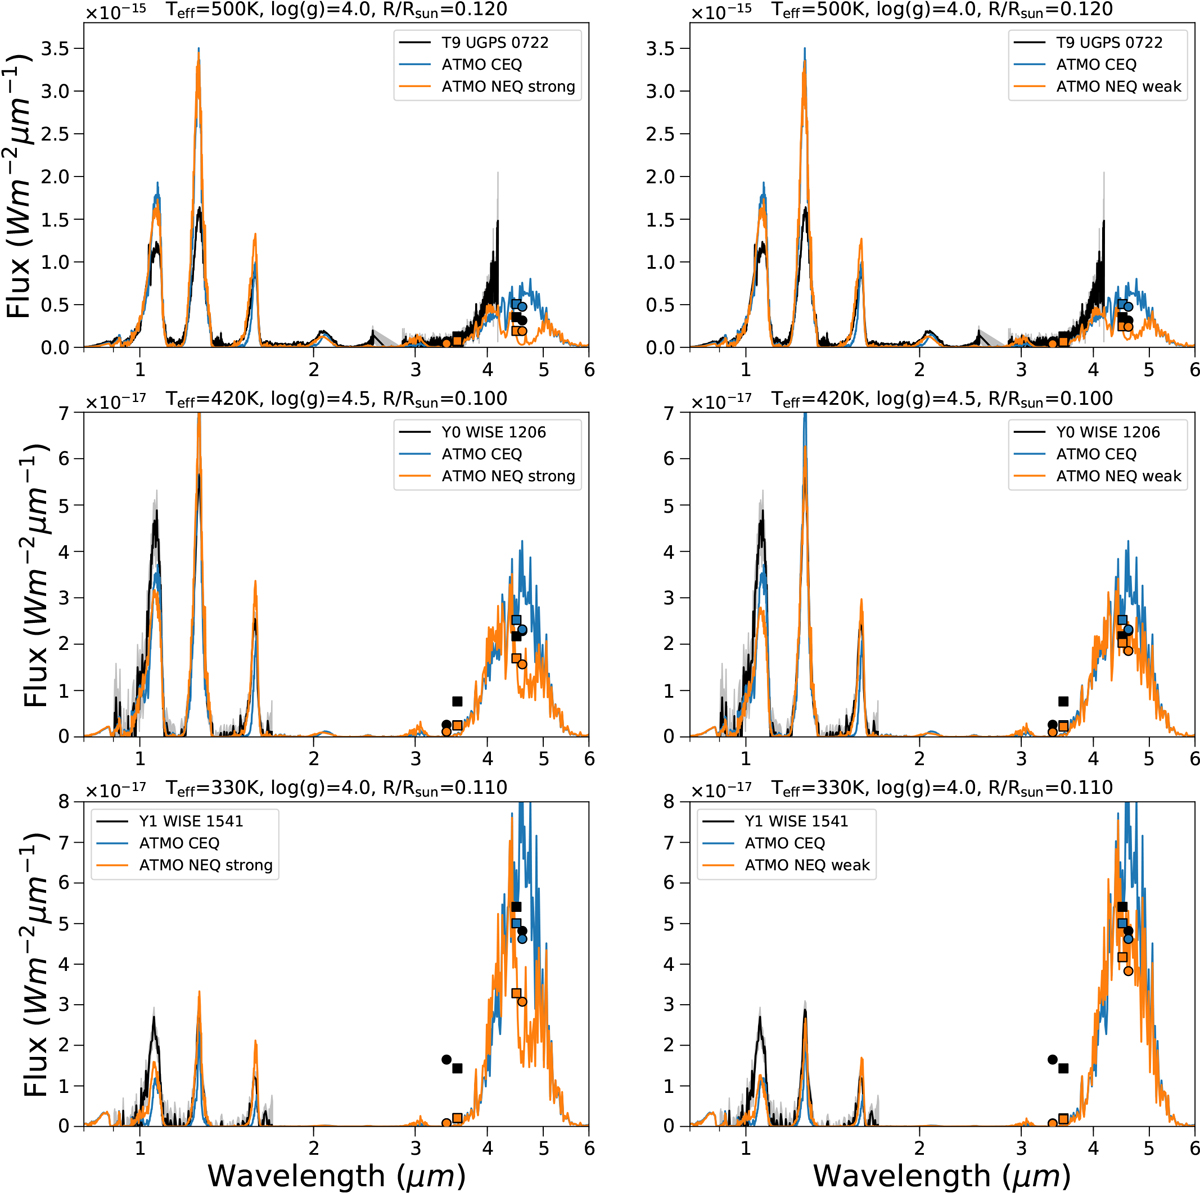
Comparison of the chemical equilibrium (blue) and non-equilibrium (orange) models of this work to sample spectra (black) forming a T–Y spectral sequence. Left and right columns: non-equilibrium models with the strong and weak Kzz mixing relationships with surface gravity, respectively. Spitzer IRAC photometry is plotted as squares and WISE photometryas circles. Top panel: observed spectrum of the T9 dwarf UGPS 0722 (Lucas et al. 2010; Leggett et al. 2012), with Spitzer IRAC and WISE photometric points from Kirkpatrick et al. (2012). Middle and bottom panels: 0.9− 1.7 μm HST WFC3spectra of the Y0- and Y1-type dwarfs WISE 1206 and WISE 1541 (Schneider et al. 2015), with Spitzer IRAC photometry also from Schneider et al. (2015) and WISE photometry from Cutri et al. (2013).
Current usage metrics show cumulative count of Article Views (full-text article views including HTML views, PDF and ePub downloads, according to the available data) and Abstracts Views on Vision4Press platform.
Data correspond to usage on the plateform after 2015. The current usage metrics is available 48-96 hours after online publication and is updated daily on week days.
Initial download of the metrics may take a while.