Fig. 13
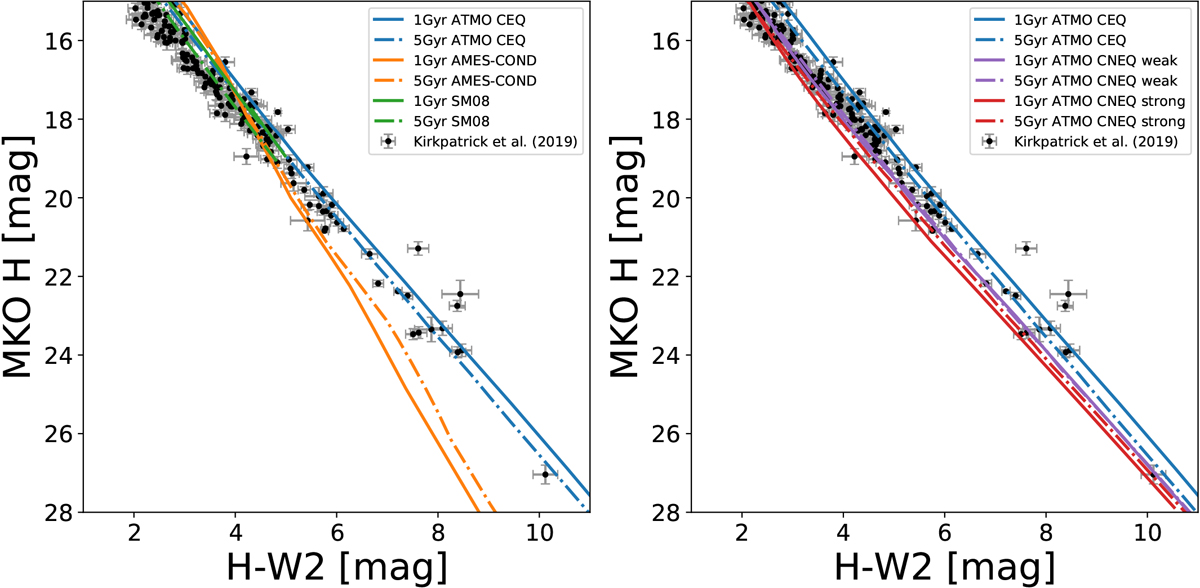
H−W2 colour as a function of absolute H-band magnitude, with photometry of late T and Y dwarfs within 20 pc from Kirkpatrick et al. (2019) plotted as black circles. Overplotted in the left panel are isochrones of chemical equilibrium models from this work (in blue), from B03 (in orange), and from SM08 (in green). Overplotted in the right panel are isochrones of chemical equilibrium models (in blue), and non-equilibrium chemistry models with weak and strong vertical mixing (in purple and red, respectively).
Current usage metrics show cumulative count of Article Views (full-text article views including HTML views, PDF and ePub downloads, according to the available data) and Abstracts Views on Vision4Press platform.
Data correspond to usage on the plateform after 2015. The current usage metrics is available 48-96 hours after online publication and is updated daily on week days.
Initial download of the metrics may take a while.