Open Access
Fig. 5.
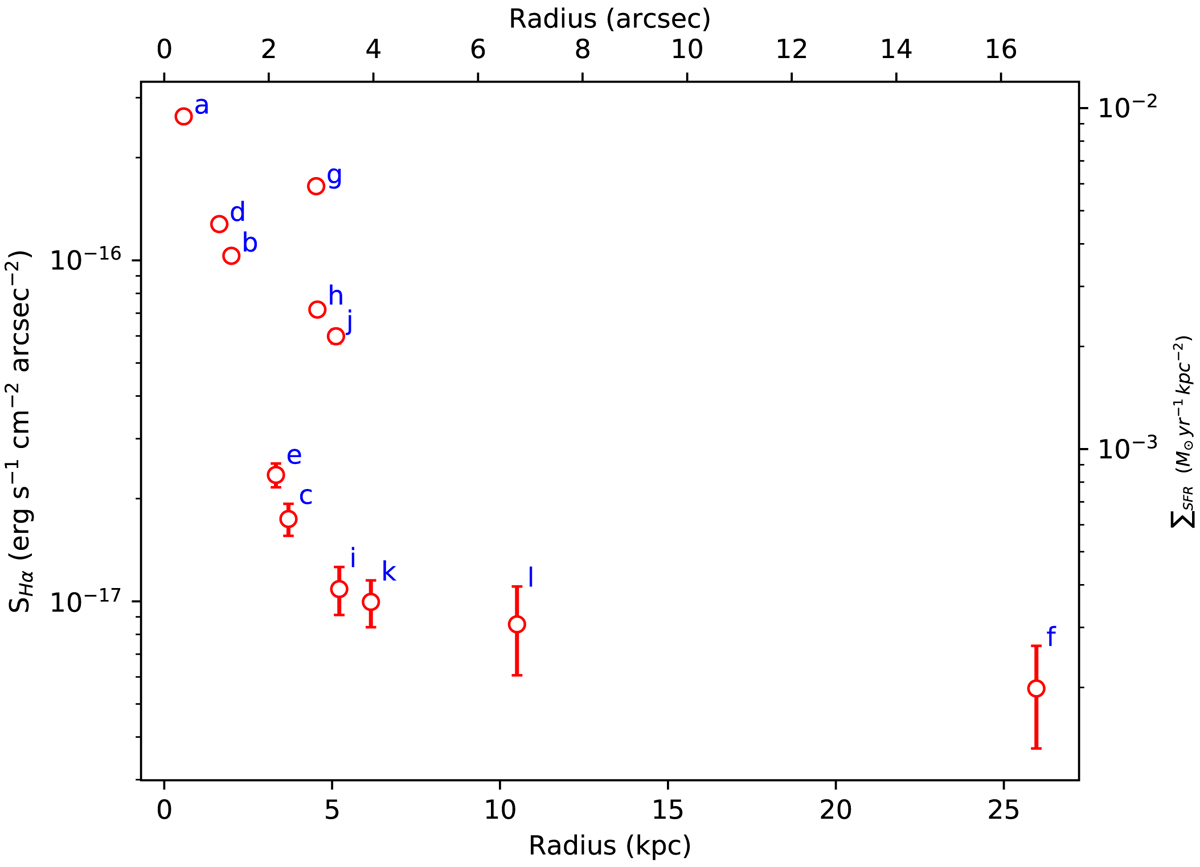
Hα surface brightness measured for different regions of Malin 1. The axis in the right shows the star formation surface density (ΣSFR), corresponding to the observed Hα flux, using the calibration from Boissier (2013). The region name of each point is indicated with blue letters.
Current usage metrics show cumulative count of Article Views (full-text article views including HTML views, PDF and ePub downloads, according to the available data) and Abstracts Views on Vision4Press platform.
Data correspond to usage on the plateform after 2015. The current usage metrics is available 48-96 hours after online publication and is updated daily on week days.
Initial download of the metrics may take a while.