Fig. 3.
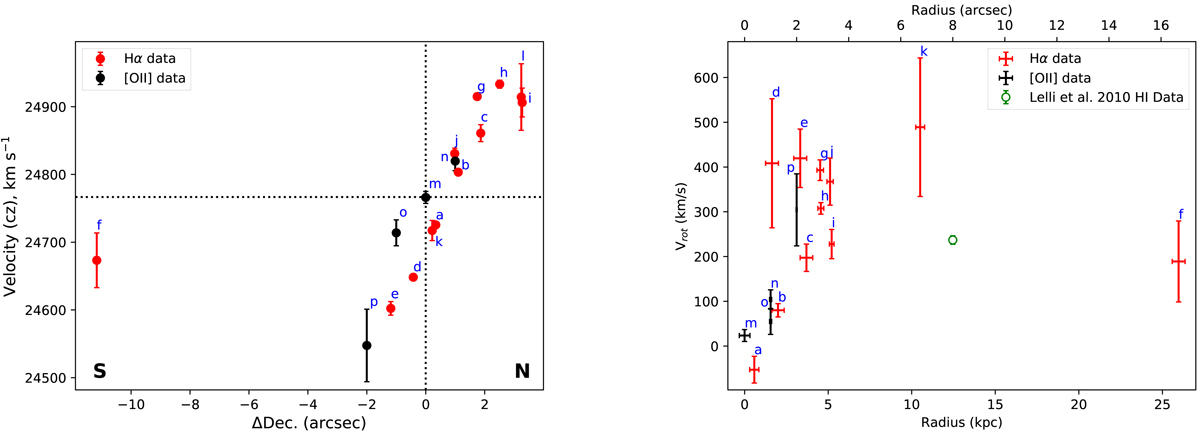
Left: line-of-sight velocity measured from the observed shift in wavelengths for the Hα and [O II] lines (see Tables 2 and 3). The x-axis corresponds to the projected radius on the major axis of the galaxy in the plane of sky. The thick horizontal and vertical dashed lines denote the Vsys and major axis of the galaxy, respectively. Right: rotation curve of Malin 1, projected on the plane of the galaxy. The red and black points indicate the Hα data and [O II] data, respectively. The green open circle shows the Lelli et al. (2010) H I data point in the same radial range. The region name of each point is inidcated with blue letters.
Current usage metrics show cumulative count of Article Views (full-text article views including HTML views, PDF and ePub downloads, according to the available data) and Abstracts Views on Vision4Press platform.
Data correspond to usage on the plateform after 2015. The current usage metrics is available 48-96 hours after online publication and is updated daily on week days.
Initial download of the metrics may take a while.